

EU-28 exports in August 2016 compared to August 2015 increased in volumes for:
- Butter (+35.3%)
- Milk and cream (+30.3%)
- Infant milk formula (+26.6%)
- Whey Powder (+21.2%)
- Cheese (+18.9%)
- WMP (+5.1%)
decreased for:
- SMP (-31.0%)
The value of exports was 9.107 Mio €; the value of imports was 512 Mio €, so the commercial balance is positive (trade surplus: 8.595 Mio €)
The main regions importing European dairy products (cheese, milk powders, butter, condensed milk, liquid milk, cream and yogurt) were:
- Africa import, accounting for 24% of market share, decreased by 14.6%
- Asia – South East import, accounting for 29% of market share, increased by 2.1%
- Asia – Middle East import, accounting for 20% of market share, increased by 6.8%
- North America import, accounting for 7% of market share, increased by 4.4%
- Europe (Others – extra EU) import, accounting for 7% of market share, increased by 10.3%
| EU-28: dairy products Export year-to-date (August) | |||||||||||||||||||||||||||||||||||||
| QUANTITY (Tons) | VALUE (’000 EUR) | ||||||||||||||||||||||||||||||||||||
| 2015 | 2016 | ± on 2015 | 2015 | 2016 | ± on 2015 | ||||||||||||||||||||||||||||||||
| Infant milk formula | 276.229 | 307.322 | +11,3% | 2.431.085 | 2.587.953 | +6,5% | |||||||||||||||||||||||||||||||
| Cheese | 460.135 | 523.695 | +13,8% | 2.257.504 | 2.325.813 | +3,0% | |||||||||||||||||||||||||||||||
| WMP | 274.456 | 273.868 | -0,2% | 846.345 | 784.341 | -7,3% | |||||||||||||||||||||||||||||||
| SMP | 477.910 | 390.229 | -18,3% | 1.054.954 | 758.922 | -28,1% | |||||||||||||||||||||||||||||||
| Butter | 114.315 | 160.036 | +40,0% | 467.001 | 605.833 | +29,7% | |||||||||||||||||||||||||||||||
| Milk and cream | 524.069 | 726.629 | +38,7% | 442.262 | 551.897 | +24,8% | |||||||||||||||||||||||||||||||
| Whey Powder | 403.214 | 430.448 | +6,8% | 598.844 | 535.567 | -10,6% | |||||||||||||||||||||||||||||||
| Condensed Milk | 243.698 | 180.414 | -26,0% | 396.947 | 291.930 | -26,5% | |||||||||||||||||||||||||||||||
| Yogurt and buttermilk | 105.029 | 112.415 | +7,0% | 188.291 | 199.745 | +6,1% | |||||||||||||||||||||||||||||||
| Caseinates | 27.621 | 59.219 | +114,4% | 177.405 | 161.913 | -8,7% | |||||||||||||||||||||||||||||||
| Casein | 25.577 | 27.654 | +8,1% | 173.233 | 149.866 | -13,5% | |||||||||||||||||||||||||||||||
| Lactose Pharmaceutical | 111.211 | 104.947 | -5,6% | 137.996 | 122.718 | -11,1% | |||||||||||||||||||||||||||||||
| Other products* | 10.630 | 10.415 | -2,0% | 50.760 | 30.289 | -40,3% | |||||||||||||||||||||||||||||||
| TOTAL EXPORT | 3.054.093 | 3.307.289 | +8,3% | 9.222.627 | 9.106.786 | -1,3% | |||||||||||||||||||||||||||||||
|
* Other products: MPC prot.cont. >85%, Lactose edible Data processed by Clal based on GTIS source. |
|||||||||||||||||||||||||||||||||||||
|
|||||||||||||||||||||||||||||||||||||
|
EU-28: CHEESE EXPORT Main IMPORTERS of 2016 Period: January-August |
|||||
| Ton | Share 2016 |
2014 | 2015 | 2016 | % on 2015 |
| TOTAL | 499.718 | 460.135 | 523.695 | +14% | |
| United States | 17% | 72.432 | 87.011 | 88.748 | +2% |
| Japan | 9% | 29.511 | 43.841 | 48.715 | +11% |
| Switzerland | 7% | 35.853 | 36.634 | 38.136 | +4% |
| Saudi Arabia | 6% | 21.790 | 25.251 | 30.415 | +20% |
| Korea, South | 6% | 11.534 | 22.860 | 29.742 | +30% |
Do you need additional information on dairy Import/Export? Subscribe to the Dairy World Trade area on CLAL.it
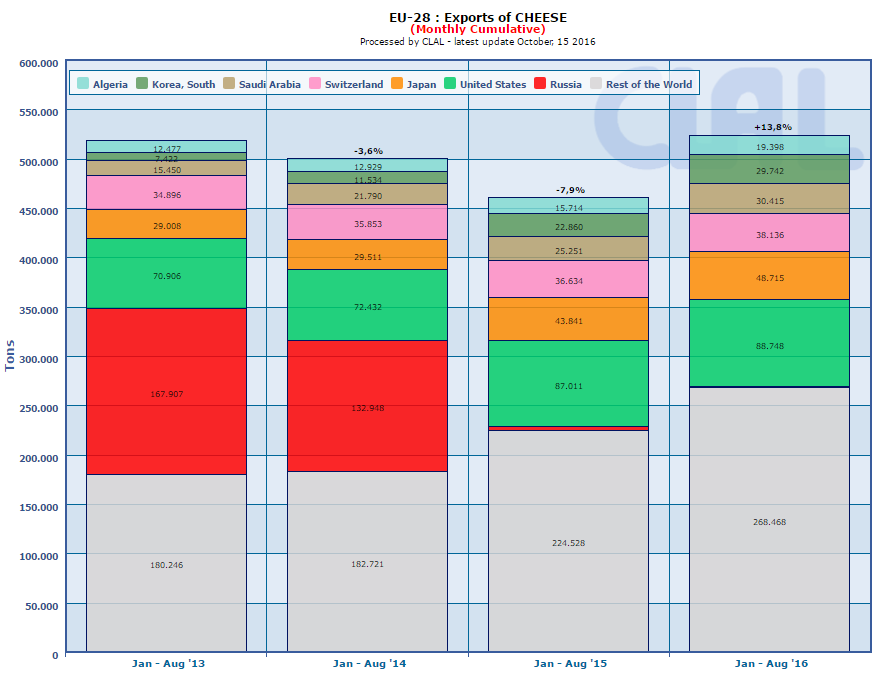
CLAL.it – EU-28: cheese export (monthly cumulative)
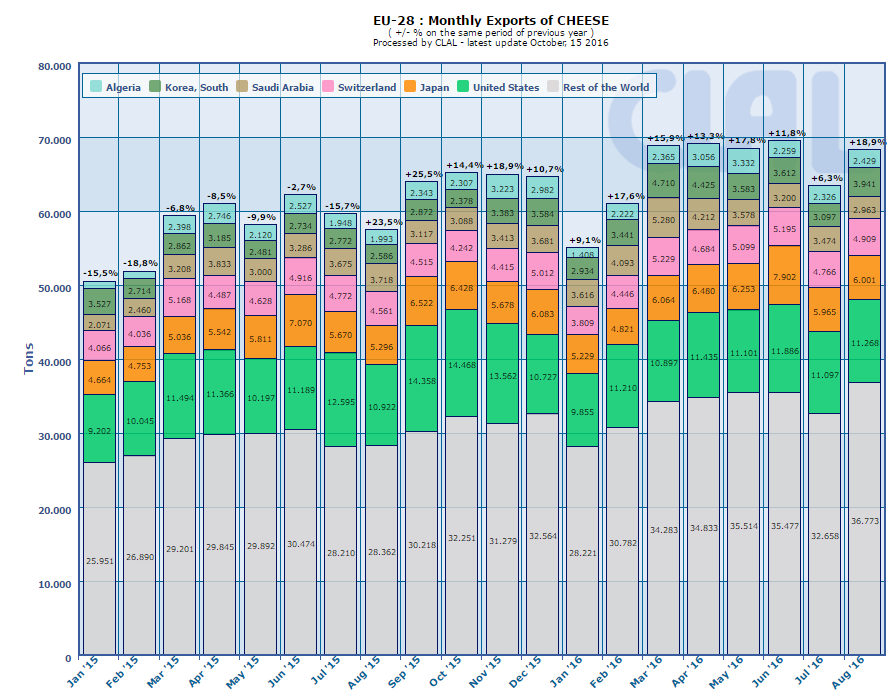
CLAL.it – EU-28: cheese monthly export


 ... share
The CLAL.it team is composed of young people who with the help of Computer Science study the dairy market and develop tools to provide the Operators of the dairy sector with a comprehensive real-time view of the national and international market trends.
[…] Entre Janvier et août 2016, les exportations ont bondi de +14% par rapport à la même période en 2015, elle même en chute de 8% par rapport à 2014 (effet russe)…. […]