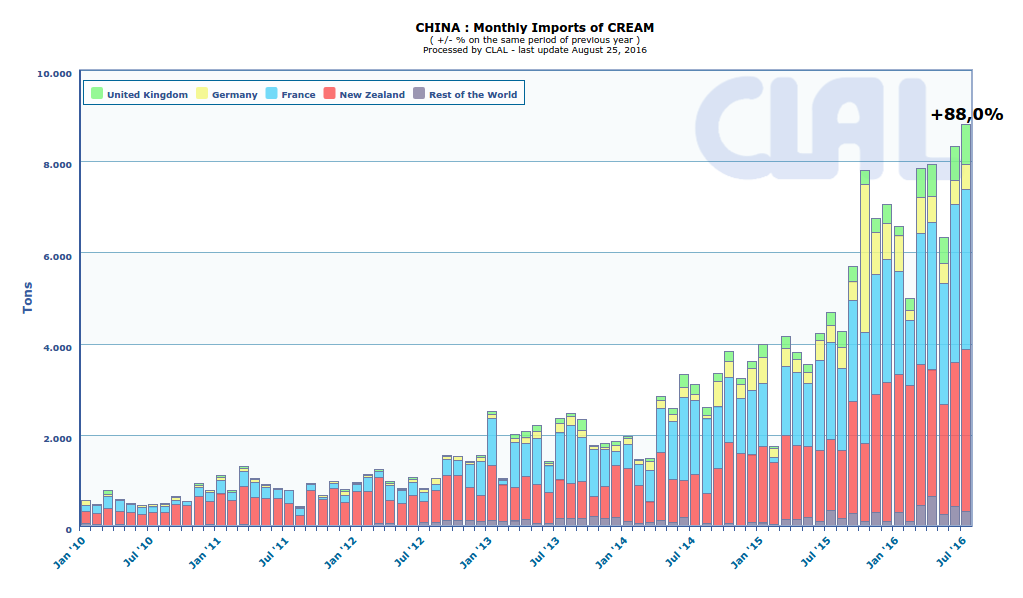
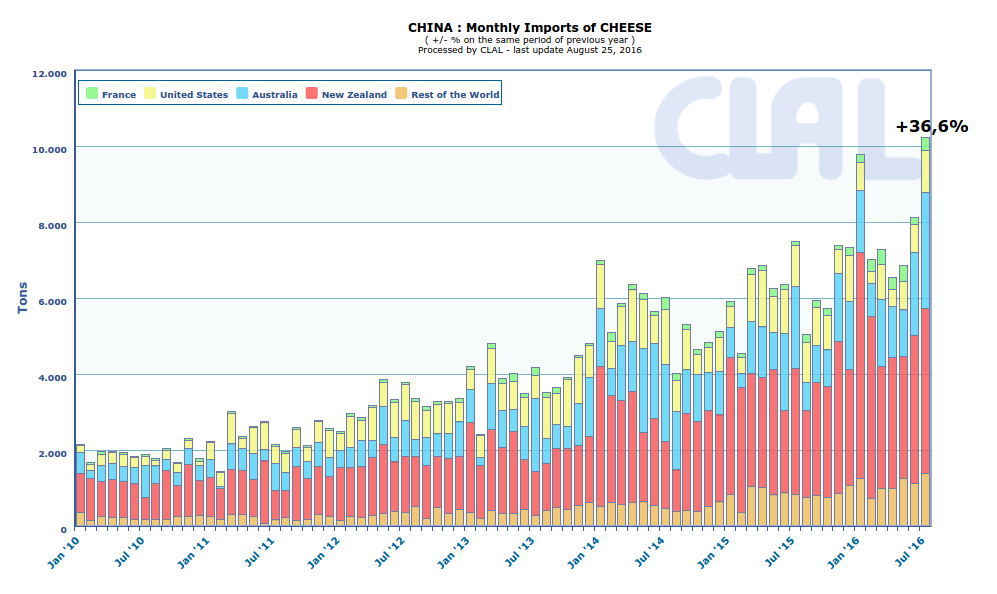
China imports in July 2016 compared to July 2015 increased in volumes for:
- Condensed Milk (+77.0%)
- Infant milk formula (+63.8%)
- Cheese (+36.6%)
- Milk (+27.8%)
- Cream (+88.0%)
- Butter (+33.6%)
- WMP (+4.9%)
decreased for:
- Whey Powder (-4.1%)
- SMP (-26.9%)
| CHINA: dairy products Import year-to-date (July) | ||||||
| QUANTITY (Tons) | VALUE (’000 USD) | |||||
| 2015 | 2016 | ± on 2015 | 2015 | 2016 | ± on 2015 | |
| Infant milk formula | 89.183 | 116.664 | +30,8% | 1.225.807 | 1.592.470 | +29,9% |
| WMP | 259.146 | 318.737 | +23,0% | 728.869 | 797.413 | +9,4% |
| Milk and cream | 216.337 | 367.553 | +69,9% | 244.263 | 371.211 | +52,0% |
| of which: | ||||||
| - Milk | 190.217 | 316.813 | +66,6% | 170.626 | 235.553 | +38,1% |
| - Cream | 26.121 | 50.740 | +94,3% | 73.637 | 135.658 | +84,2% |
| SMP | 126.379 | 126.943 | +0,4% | 344.632 | 274.181 | -20,4% |
| Whey Powder | 248.170 | 278.130 | +12,1% | 337.245 | 244.853 | -27,4% |
| Cheese | 44.160 | 55.801 | +26,4% | 207.597 | 237.583 | +14,4% |
| Butter | 38.760 | 52.179 | +34,6% | 151.579 | 188.317 | +24,2% |
| Caseinates | 10.039 | 9.550 | -4,9% | 91.509 | 64.073 | -30,0% |
| Lactose Pharmaceutical | 47.033 | 47.011 | -0,0% | 42.622 | 30.828 | -27,7% |
| Yogurt and buttermilk | 4.452 | 11.395 | +156,0% | 13.369 | 24.418 | +82,7% |
| Condensed Milk | 6.157 | 10.926 | +77,5% | 12.958 | 20.835 | +60,8% |
| Other products* | 7.499 | 5.354 | -28,6% | 14.101 | 8.530 | -39,5% |
| TOTAL IMPORT | 1.097.316 | 1.400.243 | +27,6% | 3.414.550 | 3.854.713 | +12,9% |
|
* Other products: Lactose edible Data processed by Clal based on GTIS source. |
||||||
|
China: CHEESE IMPORT Main EXPORTERS of 2016 Period: January-July |
|||||
| Ton | Share 2016 |
2014 | 2015 | 2016 | % on 2015 |
| TOTAL | 42.061 | 44.160 | 55.801 | +26% | |
| New Zealand | 52% | 18.008 | 21.529 | 28.847 | +34% |
| Australia | 22% | 11.259 | 9.023 | 12.051 | +34% |
| United States | 9% | 7.689 | 6.885 | 5.003 | -27% |
| France | 4% | 1.153 | 959 | 2.198 | +129% |
| Denmark | 3% | 571 | 1.551 | 1.623 | +5% |
|
China: CREAM IMPORT Main EXPORTERS of 2016 Period: January-July |
|||||
| Ton | Share 2016 |
2014 | 2015 | 2016 | % on 2015 |
| TOTAL | 16.723 | 26.121 | 50.740 | +94% | |
| New Zealand | 41% | 6.821 | 11.183 | 21.004 | +88% |
| France | 38% | 7.355 | 10.109 | 19.435 | +92% |
| United Kingdom | 8% | 835 | 1.337 | 3.941 | +195% |
| Germany | 8% | 1.107 | 2.502 | 3.884 | +55% |
| Australia | 4% | 208 | 614 | 1.887 | +208% |
Do you need additional information on dairy Import/Export? Subscribe to the Dairy World Trade area on CLAL.it


Leave a Reply
You must be registered and logged in to post a comment.