

China confirms the trend of imports of high-value-added products. On the other hand, imports of semi-finished products (such as milk and powders) decrease.
Overall, in March 2017, there was an increase in unit prices on a trend basis (as compared to March 2016).
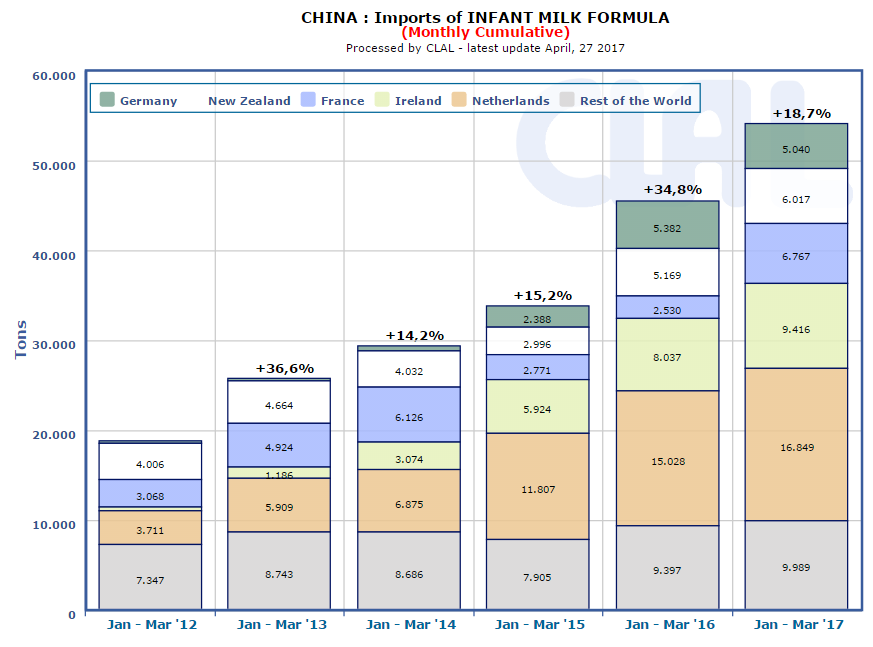
Exports from Europe grows, specially in baby milk’s area. In the period January-March 2017, the market share of The Netherlands, Ireland, France, Germany, Denmark and Switzerland was 78%, with a significant growth of France (+168%) and Switzerland (+153%). Top exporters are the Netherlands and Ireland, which together export over 26,000 tonnes of baby milk in the first quarter of 2017 and represent, together, a market share of 48%.
Focusing on Whey Powder Exporters, Poland is the fourth exporter (the third among EU Member States), with a +2% growth in the first quarter of 2017 on a trend basis. First exporter is United States, with 59% market share.
Looking at Milk and Cream market, Spain scored an increase of 129% and occupies a market share of 2%. Still not completely significant, but it’s a signal about the vitality of the Spanish agri-food economy.
Italian cheese exports to China grow again: +18% in the first quarter of 2017 on a trend basis. Now Italy has reached Denmark with a 3% market share.
| CHINA: dairy products Import year-to-date (March) | ||||||
| QUANTITY (Tons) | VALUE (’000 USD) | |||||
| 2016 | 2017 | ± on 2016 | 2016 | 2017 | ± on 2016 | |
| Infant milk formula | 45.543 | 54.078 | +18,7% | 652.094 | 732.054 | +12,3% |
| WMP | 204.154 | 196.106 | -3,9% | 501.164 | 593.531 | +18,4% |
| SMP | 72.378 | 74.343 | +2,7% | 151.614 | 179.825 | +18,6% |
| Whey Powder | 110.961 | 122.719 | +10,6% | 101.517 | 148.240 | +46,0% |
| Milk and cream | 135.369 | 121.310 | -10,4% | 137.010 | 137.254 | +0,2% |
| Cheese | 24.059 | 28.132 | +16,9% | 102.573 | 122.760 | +19,7% |
| Butter | 28.284 | 24.011 | -15,1% | 96.931 | 107.694 | +11,1% |
| Other products* | 33.149 | 37.473 | +13,0% | 59.693 | 64.533 | +8,1% |
| TOTAL IMPORT | 653.895 | 658.172 | +0,7% | 1.802.598 | 2.085.891 | +15,7% |
|
* Other products: Caseinates, Lactose Pharmaceutical, Yogurt and buttermilk, Condensed Milk, Lactose edible Data processed by Clal based on GTIS source. |
||||||
|
China: INFANT MILK FORMULA IMPORT Main EXPORTERS of 2017 Period: January-March |
|||||
| Ton | Share 2017 |
2015 | 2016 | 2017 | % on 2016 |
| TOTAL | 33.790 | 45.543 | 54.078 | +19% | |
| Netherlands | 31% | 11.807 | 15.028 | 16.849 | +12% |
| Ireland | 17% | 5.924 | 8.037 | 9.416 | +17% |
| France | 13% | 2.771 | 2.530 | 6.767 | +168% |
| New Zealand | 11% | 2.996 | 5.169 | 6.017 | +16% |
| Germany | 9% | 2.388 | 5.382 | 5.040 | -6% |
| Denmark | 5% | 1.722 | 2.289 | 2.794 | +22% |
| Switzerland | 3% | 661 | 743 | 1.877 | +153% |
|
China: CHEESE IMPORT Main EXPORTERS of 2017 Period: January-March |
|||||
| Ton | Share 2017 |
2015 | 2016 | 2017 | % on 2016 |
| TOTAL | 17.205 | 24.059 | 28.132 | +17% | |
| New Zealand | 54% | 9.882 | 13.926 | 15.221 | +9% |
| Australia | 22% | 2.530 | 4.239 | 6.249 | +47% |
| United States | 9% | 2.189 | 2.011 | 2.428 | +21% |
| Denmark | 3% | 499 | 945 | 922 | -2% |
| Italy | 3% | 495 | 673 | 797 | +18% |
Do you need additional information on dairy Import/Export? Subscribe to the Dairy World Trade area on CLAL.it
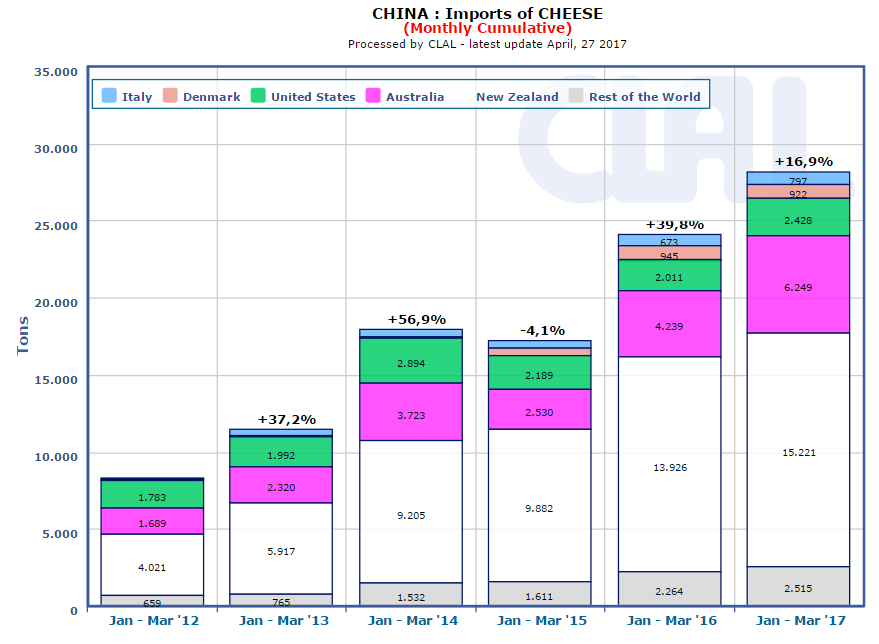
CLAL.it – China: Import of cheese (monthly cumulative)
CLAL.it – China: Import of Infant milk formula (monthly cumulative)


 ... share
The CLAL.it team is composed of young people who with the help of Computer Science study the dairy market and develop tools to provide the Operators of the dairy sector with a comprehensive real-time view of the national and international market trends.
Leave a Reply
You must be registered and logged in to post a comment.