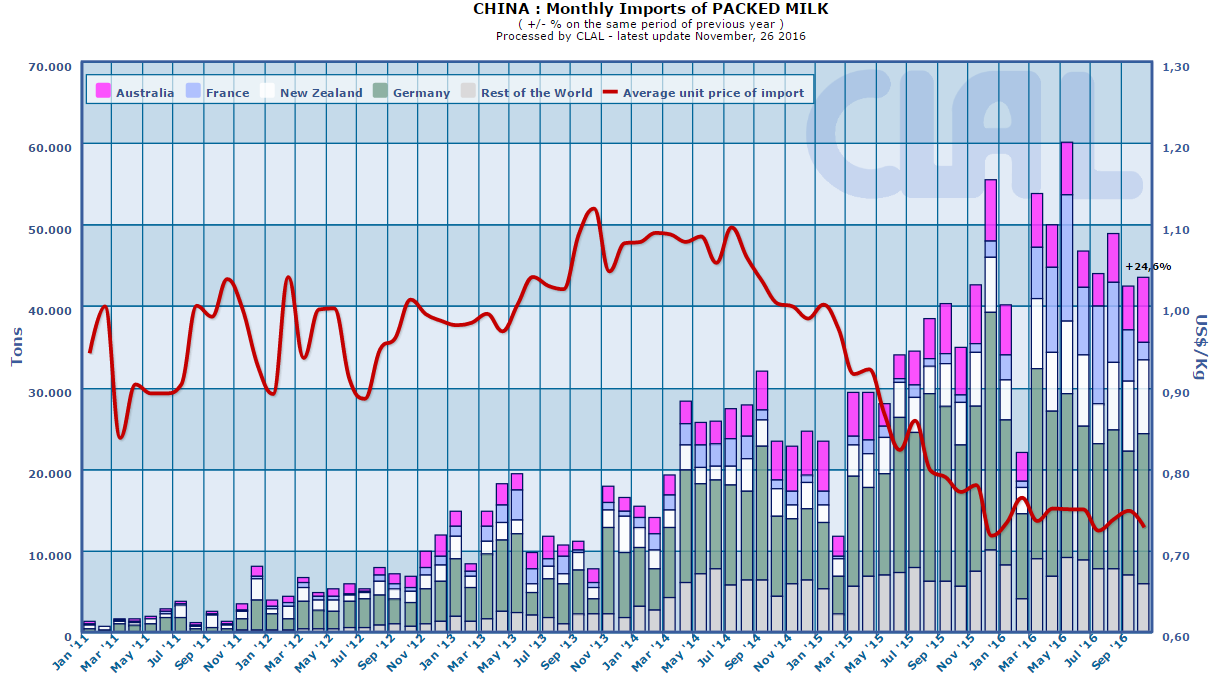
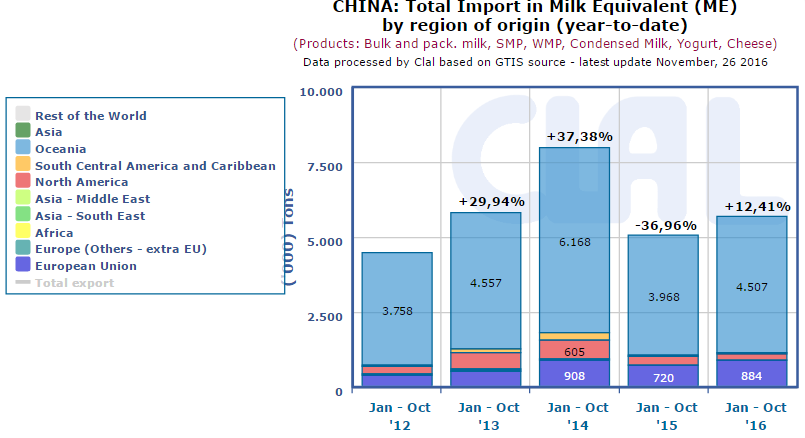
VOLUMES:
China imports in OCTOBER 2016 compared to October 2015 increased in volumes for:
- Packaged milk (+24.6%)
- Cheese (+39.1%)
- Infant milk formula (+31.3%)
- SMP (+14.0%)
- Whey Powder (+9.0%)
decreased for:
- Cream (-7.2%)
- WMP (-10.7%)
- Butter (-18.7%)
UNIT PRICES:
The unit prices of China imports in OCTOBER 2016 compared to October 2015 increased for:
- Cream (+51.1%)
- Butter (+11.3%)
decreased for:
- Packaged milk (-5.6%)
- Cheese (-1.4%)
- WMP (-2.1%)
- Infant milk formula (-2.6%)
- Whey Powder (-3.7%)
- SMP (-14.8%)
| CHINA: dairy products Import year-to-date (October) | ||||||
| QUANTITY (Tons) | VALUE (’000 USD) | |||||
| 2015 | 2016 | ± on 2015 | 2015 | 2016 | ± on 2015 | |
| Infant milk formula | 136.770 | 174.052 | +27,3% | 1.890.375 | 2.375.243 | +25,6% |
| WMP | 299.851 | 355.128 | +18,4% | 844.631 | 898.295 | +6,4% |
| Milk and cream | 347.629 | 523.918 | +50,7% | 375.880 | 531.535 | +41,4% |
| of which: | ||||||
| - Packaged milk | 303.763 | 451.602 | +48,7% | 260.005 | 335.080 | +28,9% |
| - Cream | 43.866 | 72.316 | +64,9% | 115.876 | 196.455 | +69,5% |
| Whey Powder | 357.487 | 411.905 | +15,2% | 455.559 | 366.104 | -19,6% |
| SMP | 172.805 | 161.155 | -6,7% | 458.013 | 344.327 | -24,8% |
| Cheese | 60.857 | 78.370 | +28,8% | 284.253 | 338.071 | +18,9% |
| Butter | 55.717 | 69.028 | +23,9% | 215.420 | 254.108 | +18,0% |
| Other products* | 104.372 | 118.021 | +13,1% | 226.610 | 208.960 | -7,8% |
| TOTAL IMPORT | 1.535.488 | 1.891.576 | +23,2% | 4.750.741 | 5.316.643 | +11,9% |
|
* Other products: Caseinates, Lactose Pharmaceutical, Yogurt and buttermilk, Condensed Milk, Lactose edible Data processed by Clal based on GTIS source. |
||||||
|
China: PACKAGED MILK IMPORT Main EXPORTERS of 2016 Period: January-October |
|||||
| Ton | Share 2016 |
2014 | 2015 | 2016 | % on 2015 |
| TOTAL | 239.446 | 303.763 | 451.602 | +49% | |
| Germany | 39% | 105.985 | 146.893 | 174.221 | +19% |
| France | 16% | 21.694 | 11.245 | 74.357 | +561% |
| New Zealand | 16% | 26.705 | 39.104 | 72.736 | +86% |
| Australia | 12% | 31.295 | 46.317 | 55.858 | +21% |
| Poland | 4% | 6.214 | 9.189 | 16.889 | +84% |
Do you need additional information on dairy Import/Export? Subscribe to the Dairy World Trade area on CLAL.it


[…] Empty description […]