

VOLUMES:
EU-28 exports in DECEMBER 2016 compared to December 2015 increased in volumes for:
- Infant milk formula (+13.8%)
decreased for
- Cheese (-2.5%)
- Milk and cream (-3.9%)
- Whey Powder (-8.5%)
- SMP (-14.4%)
- WMP (-24.9%)
- Butter (-48.1%)
UNIT PRICES:
The unit prices of EU-28 exports in DECEMBER 2016 compared to December 2015 increased for:
- Butter (+27.7%)
- WMP (+16.6%)
- Whey Powder (+9.7%)
- Milk and cream (+6.7%)
- SMP (+1.4%)
decreased for:
- Cheese (-0.8%)
- Infant milk formula (-3.3%)
The value of exports was 13.889 Mio €; the value of imports was 810 Mio €, so the commercial balance is positive (trade surplus: 13.079 Mio €)
| EU-28: dairy products Export year-to-date (December) | |||||||||||||||||||||||||||||||||||||
| QUANTITY (Tons) | VALUE (’000 EUR) | ||||||||||||||||||||||||||||||||||||
| 2015 | 2016 | ± on 2015 | 2015 | 2016 | ± on 2015 | ||||||||||||||||||||||||||||||||
| Infant milk formula | 425.591 | 477.503 | +12,2% | 3.684.783 | 4.047.174 | +9,8% | |||||||||||||||||||||||||||||||
| Cheese | 718.579 | 800.155 | +11,4% | 3.482.824 | 3.620.222 | +3,9% | |||||||||||||||||||||||||||||||
| SMP | 691.689 | 574.184 | -17,0% | 1.496.396 | 1.137.626 | -24,0% | |||||||||||||||||||||||||||||||
| WMP | 400.112 | 380.447 | -4,9% | 1.219.087 | 1.128.697 | -7,4% | |||||||||||||||||||||||||||||||
| Butter | 178.429 | 211.691 | +18,6% | 703.430 | 835.317 | +18,7% | |||||||||||||||||||||||||||||||
| Whey Powder | 605.225 | 633.349 | +4,6% | 860.169 | 811.338 | -5,7% | |||||||||||||||||||||||||||||||
| Milk and cream | 833.499 | 1.047.248 | +25,6% | 686.835 | 806.764 | +17,5% | |||||||||||||||||||||||||||||||
| Condensed Milk | 355.921 | 277.411 | -22,1% | 586.940 | 452.786 | -22,9% | |||||||||||||||||||||||||||||||
| Yogurt and buttermilk | 162.550 | 169.213 | +4,1% | 287.105 | 301.115 | +4,9% | |||||||||||||||||||||||||||||||
| Caseinates | 52.198 | 89.410 | +71,3% | 267.609 | 250.602 | -6,4% | |||||||||||||||||||||||||||||||
| Casein | 40.534 | 44.027 | +8,6% | 267.610 | 239.841 | -10,4% | |||||||||||||||||||||||||||||||
| Lactose Pharmaceutical | 160.772 | 172.766 | +7,5% | 196.427 | 202.627 | +3,2% | |||||||||||||||||||||||||||||||
| Other products* | 16.341 | 17.733 | +8,5% | 71.666 | 55.232 | -22,9% | |||||||||||||||||||||||||||||||
| TOTAL EXPORT | 4.641.442 | 4.895.138 | +5,5% | 13.810.882 | 13.889.343 | +0,6% | |||||||||||||||||||||||||||||||
|
* Other products: MPC prot.cont. >85%, Lactose edible Data processed by Clal based on GTIS source. |
|||||||||||||||||||||||||||||||||||||
|
|||||||||||||||||||||||||||||||||||||
Do you need additional information on dairy Import/Export? Subscribe to the Dairy World Trade area on CLAL.it
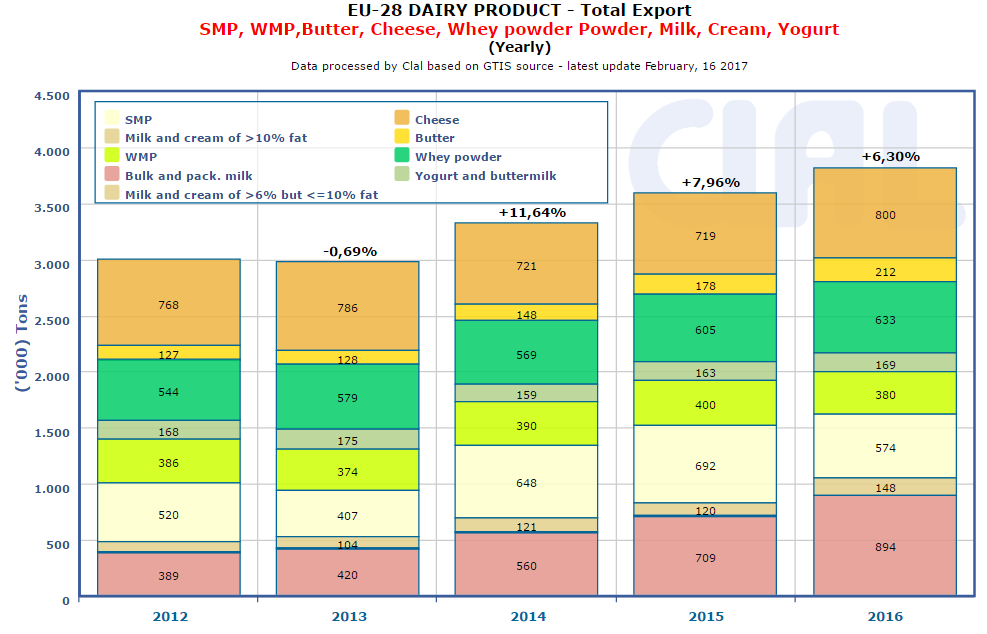
CLAL.it – EU-28: Total export of dairy products
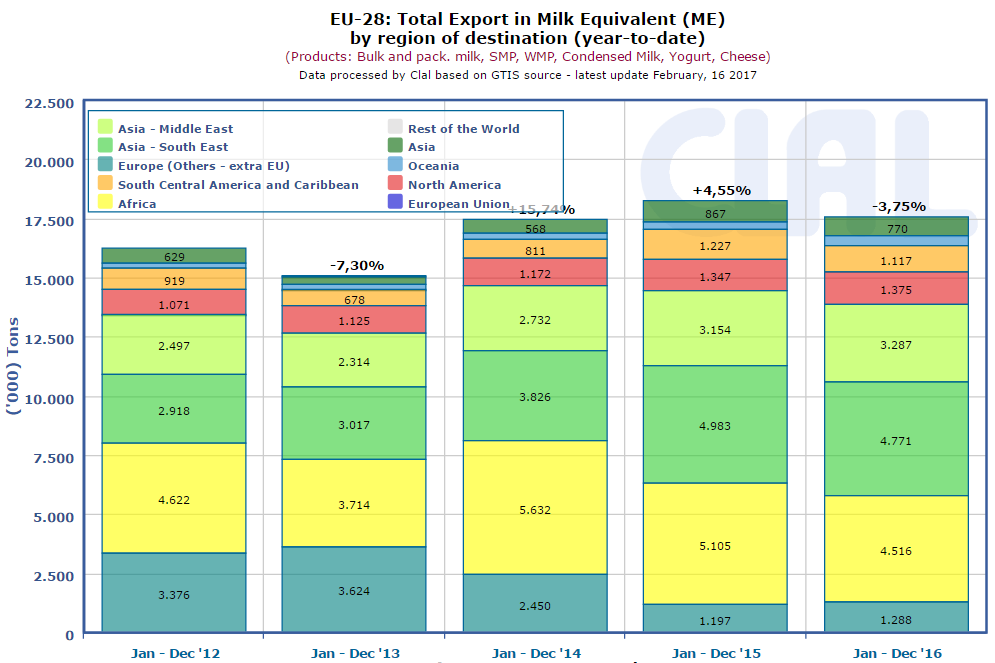
CLAL.it – EU-28: Total Export in Milk Equivalent (ME) by region of destination


 ... share
The CLAL.it team is composed of young people who with the help of Computer Science study the dairy market and develop tools to provide the Operators of the dairy sector with a comprehensive real-time view of the national and international market trends.
[…] […]