

During first half of 2016, EU milk and cream exports increased by 45% (compared to Jan-Jun 2015).
Starting from May 2015, Belarus has become a major destination for these products: during first half of 2016 its import volumes were more than 6 times bigger than the year before. Belarus ranked second among the main importers of milk and cream from EU, with a share of 11%, while China ranked first.
EU-28 exports in June 2016 compared to June 2015 increased in volumes for:
- Infant milk formula (+26.8%)
- Milk and cream (+20.4%)
- Cheese (+11.8%)
- Butter (+5.7%)
- Whey Powder (+4.4%)
- WMP (+1.4%)
decreased for:
- SMP (-24.1%)
From January to June 2016 y-o-y the exports growth accounted for 7% of the increase in milk deliveries. In fact:
- EU milk deliveries increased by 3,52% (2.707.469 Tons);
- Extra-EU exports of cheese, milk powders, butter, condensed milk, liquid milk, cream and yogurt in “milk equivalent”increased by 1,93% (186.268 Tons).
The value of exports was 6.864 Mio €; the value of imports was 385 Mio €, so the commercial balance is positive (trade surplus: 6.479 Mio €)
The main regions importing European dairy products (cheese, milk powders, butter, condensed milk, liquid milk, cream and yogurt) were:
- Africa import, accounting for 24% of market share, decreased by 13.8%
- Asia – South East import, accounting for 30% of market share, increased by 8%
- Asia – Middle East import, accounting for 20% of market share, increased by 10.4%
- North America import, accounting for 7% of market share, increased by 7.2%
- Europe (Others – extra EU) import, accounting for 7% of market share, increased by 7.8%.
| EU-28: dairy products Export year-to-date (June) | |||||||||||||||||||||||||||||||||||||
| QUANTITY (Tons) | VALUE (’000 EUR) | ||||||||||||||||||||||||||||||||||||
| 2015 | 2016 | ± on 2015 | 2015 | 2016 | ± on 2015 | ||||||||||||||||||||||||||||||||
| Infant milk formula | 209.421 | 231.949 | +10,8% | 1.887.936 | 1.934.801 | +2,5% | |||||||||||||||||||||||||||||||
| Cheese | 343.105 | 392.115 | +14,3% | 1.690.734 | 1.747.599 | +3,4% | |||||||||||||||||||||||||||||||
| SMP | 359.395 | 310.214 | -13,7% | 816.479 | 604.542 | -26,0% | |||||||||||||||||||||||||||||||
| WMP | 199.555 | 205.372 | +2,9% | 649.061 | 593.597 | -8,5% | |||||||||||||||||||||||||||||||
| Butter | 93.494 | 124.845 | +33,5% | 372.084 | 457.294 | +22,9% | |||||||||||||||||||||||||||||||
| Milk and cream | 376.266 | 546.603 | +45,3% | 326.194 | 416.406 | +27,7% | |||||||||||||||||||||||||||||||
| of which: | |||||||||||||||||||||||||||||||||||||
| - Milk | 316.680 | 471.159 | +48,8% | 195.834 | 254.329 | +29,9% | |||||||||||||||||||||||||||||||
| - Cream | 59.586 | 75.445 | +26,6 | 130.360 | 162.077 | +24,3% | |||||||||||||||||||||||||||||||
| Whey Powder | 306.619 | 318.575 | +3,9% | 462.747 | 402.899 | -12,9% | |||||||||||||||||||||||||||||||
| Condensed Milk | 171.406 | 135.556 | -20,9% | 299.394 | 224.748 | -24,9% | |||||||||||||||||||||||||||||||
| Yogurt and buttermilk | 71.216 | 84.430 | +18,6% | 144.137 | 152.896 | +6,1% | |||||||||||||||||||||||||||||||
| Caseinates | 20.619 | 44.163 | +114,2% | 136.362 | 122.011 | -10,5% | |||||||||||||||||||||||||||||||
| Casein | 19.388 | 18.657 | -3,8% | 132.206 | 101.639 | -23,1% | |||||||||||||||||||||||||||||||
| Lactose Pharmaceutical | 82.878 | 75.958 | -8,3% | 105.421 | 87.565 | -16,9% | |||||||||||||||||||||||||||||||
| Other products* | 7.827 | 6.582 | -15,9% | 38.841 | 18.184 | -53,2% | |||||||||||||||||||||||||||||||
| TOTAL EXPORT | 2.261.188 | 2.495.019 | +10,3% | 7.061.596 | 6.864.182 | -2,8% | |||||||||||||||||||||||||||||||
|
* Other products: MPC prot.cont. >85%, Lactose edible Data processed by Clal based on GTIS source. |
|||||||||||||||||||||||||||||||||||||
|
|||||||||||||||||||||||||||||||||||||
|
EU-28: MILK AND CREAM EXPORT Main IMPORTERS of 2016 Period: January-June |
|||||
| Ton | Share 2016 |
2014 | 2015 | 2016 | % on 2015 |
| TOTAL | 328.952 | 376.266 | 546.603 | +45% | |
| China | 42% | 106.489 | 132.616 | 229.141 | +73% |
| Belarus | 11% | 303 | 7.666 | 58.552 | +664% |
| Libya | 6% | 24.091 | 31.766 | 34.195 | +8% |
| Mauritania | 3% | 15.219 | 17.464 | 17.434 | -0% |
| Switzerland | 2% | 12.490 | 14.471 | 13.624 | -6% |
Do you need additional information on dairy Import/Export? Subscribe to the Dairy World Trade area on CLAL.it
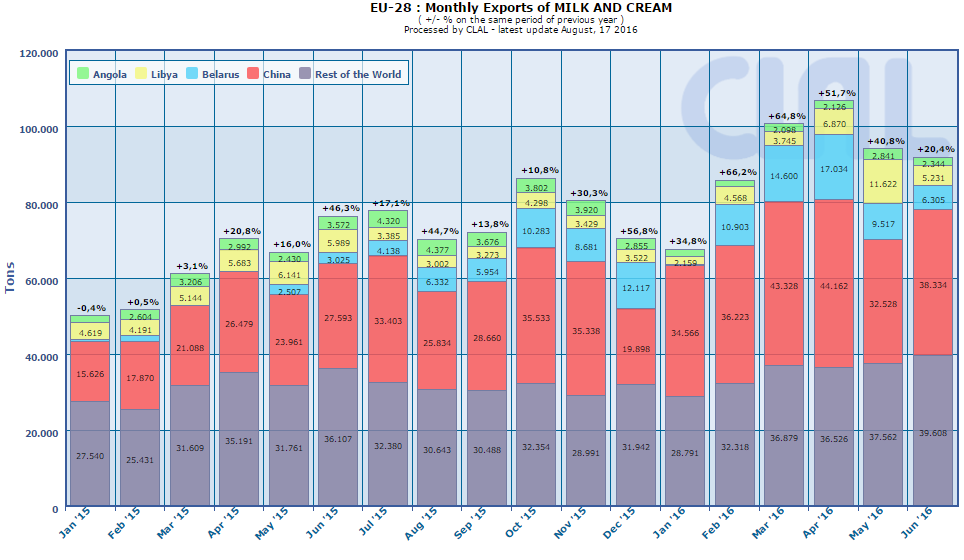
CLAL.it – EU-28: Monthly Exports of Milk and Cream

CLAL.it – EU-28: Total Export in Milk Equivalent by Region of destination


 ... share
The CLAL.it team is composed of young people who with the help of Computer Science study the dairy market and develop tools to provide the Operators of the dairy sector with a comprehensive real-time view of the national and international market trends.
Leave a Reply
You must be registered and logged in to post a comment.