The EU closed 2017 dairy extra-EU export with a +5.8% in quantity (5.17 million tons) and a + 14.5% in value (15.84 billion euros).
European Union+14.5% export dairy 2017
in milk equivalent
European exports of cheese, milk powders, butter, condensed milk, milk, cream and yogurt exceeded 20 million tonnes in milk equivalent (ME), marking an increase of 14.5% compared to 2016.
In the period January-December 2017 the increase in exports absorbed 100% of the increase in milk deliveries, in fact:
- deliveries of milk in Europe increased by 1.65% (2,536,895 tons)
- extra EU-28 exports of dairy products to ME rose by 14.5% (2,548,380 tons)
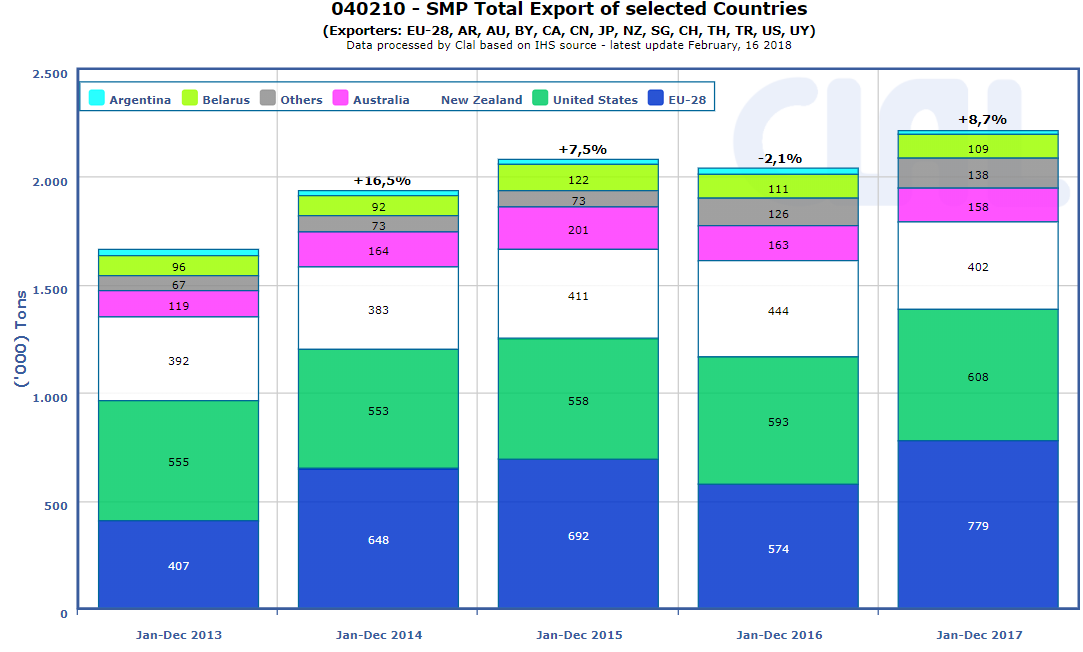
EU was the world’s largest SMP Exporter in 2017,
+36.7% in volumes, y-o-y
After a 2016 with the United States as the main SMP Exporter, in 2017 the European Union played a major role in international SMP trade, with 779,000 tons (compared to 608,000 in the USA), recording an increase of 36.7% compared to 2016. The main buyers of SMP are Algeria (+ 46.3%) and China (+ 39.4%).
In fact, the EU was supported both by the competitive price of the SMP and by the € / $ exchange rate in the first half of 2017. Since the second half of the year, the exchange rate has started to rise, reaching today’s value of 1.25.
European Cheese exports grew by 3.7% in 2017, a positive change but still lower than in the previous three years.
The United States, a key market for EU cheese exports accounting for 17% of the share, has in fact slowed down purchases (-1%). However, Japan and Switzerland, which together hold 18% of the share, are a source of growth, respectively of 20% and 6%.
| EU-28: dairy products Export year-to-date (December) | ||||||
| QUANTITY (Tons) | VALUE (’000 EUR) | |||||
| 2016 | 2017 | ± on 2016 | 2016 | 2017 | ± on 2016 | |
| Infant milk formula | 474.577 | 542.382 | +14,3% | 4.044.083 | 4.424.088 | +9,4% |
| Cheese | 799.952 | 829.512 | +3,7% | 3.619.082 | 3.992.369 | +10,3% |
| SMP | 574.336 | 778.986 | +35,6% | 1.137.023 | 1.617.467 | +42,3% |
| WMP | 381.449 | 393.142 | +3,1% | 1.127.871 | 1.369.754 | +21,4% |
| Whey Powder | 633.401 | 647.829 | +2,3% | 811.481 | 942.838 | +16,2% |
| Milk and cream | 1.046.660 | 997.368 | -4,7% | 806.140 | 923.222 | +14,5% |
| of which: | ||||||
| - Bulk and pack. milk | 893.476 | 814.567 | -8,8% | 484.290 | 496.083 | +2,4% |
| - Cream | 153.184 | 182.801 | +19,3% | 321.849 | 427.139 | +32,7% |
| Butter | 207.501 | 171.328 | -17,4% | 835.285 | 919.256 | +10,1% |
| Condensed Milk | 282.658 | 318.892 | +12,8% | 452.836 | 526.207 | +16,2% |
| Yogurt and buttermilk | 169.001 | 186.153 | +10,1% | 300.783 | 342.185 | +13,8% |
| Caseinates | 89.371 | 59.119 | -33,8% | 250.399 | 278.389 | +11,2% |
| Casein | 44.027 | 42.552 | -3,3% | 239.840 | 250.424 | +4,4% |
| Lactose Pharmaceutical | 173.384 | 189.994 | +9,6% | 202.637 | 245.209 | +21,0% |
| Other products* | 10.845 | 12.429 | +14,6% | 9.031 | 9.166 | +1,5% |
| TOTAL EXPORT | 4.887.162 | 5.169.685 | +5,8% | 13.836.491 | 15.840.575 | +14,5% |
| * Other products: Lactose edible Data processed by Clal based on GTIS source. |
||||||
Do you need additional information on dairy Import/Export? Subscribe to the Dairy World Trade area on CLAL.it


