Butter Export: the EU raises the bar
EU-28 exports in July 2016 compared to July 2015 increased in volumes for:
- Butter (+18.1%)
- Milk and cream (+13.7%)
- Whey Powder (+11.5%)
- Cheese (+6.3%)
- Infant milk formula (+5.7%)
decreased for:
- WMP (-2.0%)
- SMP (-28.0%)
The value of exports was 7.957 Mio €; the value of imports was 453 Mio €, so the commercial balance is positive (trade surplus: 7.505 Mio €)
| EU-28: dairy products Export year-to-date (July) | |||||||||||||||||||||||||||||||||||||
| QUANTITY (Tons) | VALUE (‘000 EUR) | ||||||||||||||||||||||||||||||||||||
| 2015 | 2016 | ± on 2015 | 2015 | 2016 | ± on 2015 | ||||||||||||||||||||||||||||||||
| Infant milk formula | 244.391 | 267.078 | +9,3% | 2.175.631 | 2.244.041 | +3,1% | |||||||||||||||||||||||||||||||
| Cheese | 402.702 | 455.538 | +13,1% | 1.980.523 | 2.027.195 | +2,4% | |||||||||||||||||||||||||||||||
| WMP | 242.560 | 239.808 | -1,1% | 751.851 | 689.405 | -8,3% | |||||||||||||||||||||||||||||||
| SMP | 423.924 | 353.136 | -16,7% | 941.803 | 686.244 | -27,1% | |||||||||||||||||||||||||||||||
| Butter | 104.624 | 142.397 | +36,1% | 420.808 | 531.625 | +26,3% | |||||||||||||||||||||||||||||||
| Milk and cream | 453.887 | 635.025 | +39,9% | 386.764 | 482.287 | +24,7% | |||||||||||||||||||||||||||||||
| Whey Powder | 357.023 | 374.402 | +4,9% | 534.512 | 468.435 | -12,4% | |||||||||||||||||||||||||||||||
| Condensed Milk | 213.738 | 157.113 | -26,5% | 349.273 | 254.506 | -27,1% | |||||||||||||||||||||||||||||||
| Yogurt and buttermilk | 91.101 | 97.867 | +7,4% | 164.737 | 175.388 | +6,5% | |||||||||||||||||||||||||||||||
| Caseinates | 24.406 | 51.091 | +109,3% | 158.446 | 142.726 | -9,9% | |||||||||||||||||||||||||||||||
| Casein | 22.796 | 22.455 | -1,5% | 154.855 | 121.659 | -21,4% | |||||||||||||||||||||||||||||||
| Lactose Pharmaceutical | 97.605 | 89.352 | -8,5% | 122.153 | 104.260 | -14,6% | |||||||||||||||||||||||||||||||
| Other products* | 9.310 | 9.143 | -1,8% | 45.509 | 29.493 | -35,2% | |||||||||||||||||||||||||||||||
| TOTAL EXPORT | 2.688.067 | 2.894.404 | +7,7% | 8.186.863 | 7.957.262 | -2,8% | |||||||||||||||||||||||||||||||
|
* Other products: MPC prot.cont. >85%, Lactose edible Data processed by Clal based on GTIS source. |
|||||||||||||||||||||||||||||||||||||
|
|||||||||||||||||||||||||||||||||||||
|
EU-28: BUTTER EXPORT Main IMPORTERS of 2016 Period: January-July |
|||||
| Ton | Share 2016 |
2014 | 2015 | 2016 | % on 2015 |
| TOTAL | 91.842 | 104.624 | 142.397 | +36% | |
| Saudi Arabia | 11% | 5.924 | 12.783 | 16.342 | +28% |
| China | 11% | 2.704 | 10.292 | 16.195 | +57% |
| Egypt | 9% | 2.419 | 10.495 | 12.770 | +22% |
| United States | 8% | 4.970 | 9.415 | 10.741 | +14% |
| Morocco | 5% | 3.678 | 3.275 | 7.115 | +117% |
Do you need additional information on dairy Import/Export? Subscribe to the Dairy World Trade area on CLAL.it
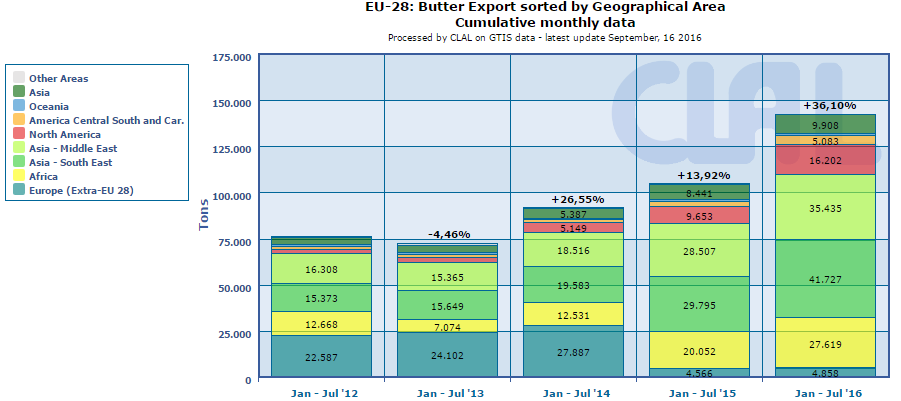
CLAL.it – EU-28: Butter export sorted by Geographical Area (cumulative monthly data)
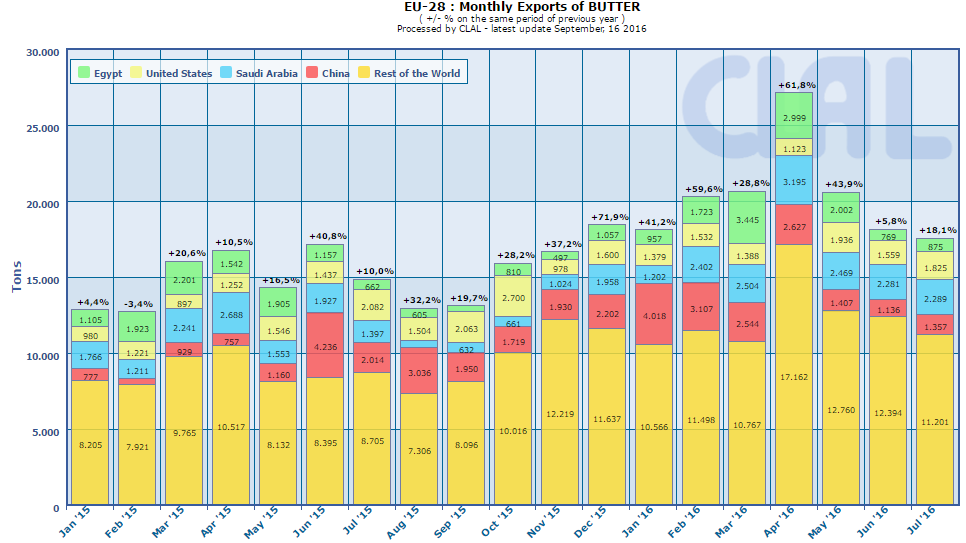
CLAL.it – EU-28: monthly export of BUTTER
The CLAL.it team is composed of young people who with the help of Computer Science study the dairy market and develop tools to provide the Operators of the dairy sector with a comprehensive real-time view of the national and international market trends.
Leave a Reply
You must be registered and logged in to post a comment.