China increases its imports of butter and milk powders, cheese slowed down
China Dairy Import
+15.3%in volume
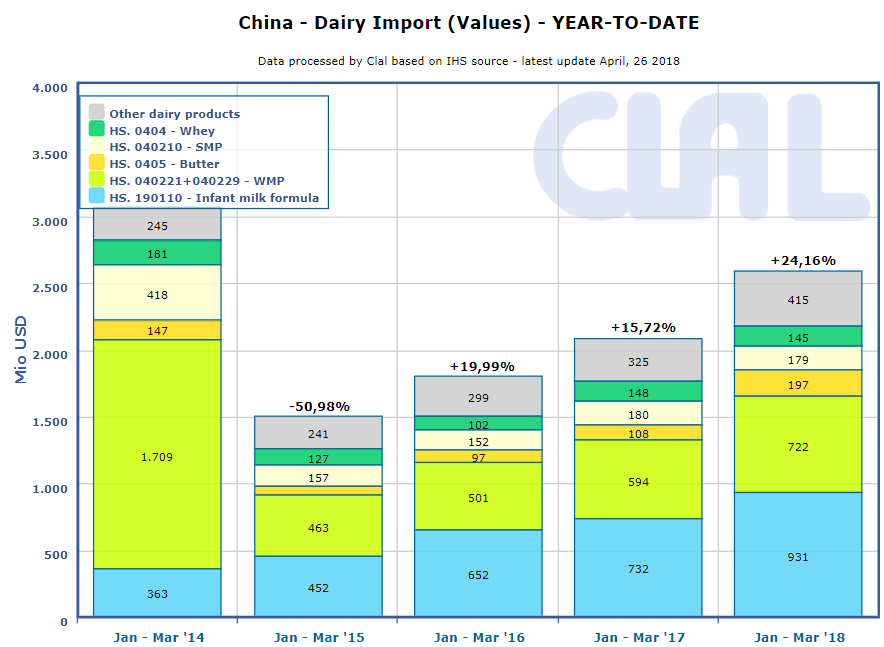
+24.2%in value
Jan-Mar 2018
Chinese dairy import kept growing fast in the first quarter of 2018: +15.3% in quantity and +24.2% in value y-o-y. Import is over 758,000 tons of milk and derivatives, for a total value of 2.58 billion dollars.
There is still much room for growth, it is evident: the key is to spread the culture of consuming dairy products.
The growth in imports is widespread among the products. Nevertheless, cream had a slowdown (-3.2% in quantity) and also cheese imports decreased by 5% in volume, while it grew by 3.6% in value.
China is confirmed as a good importer of WMP (+9.9% in quantity and +21.6% in value), packed milk (+36.3% in quantity and +60.1% in value) and whey powder (+11.5% in quantity, but -2.2% in value).
Butter had a positive acceleration, too: its imports rose by 29.9% in quantity and by 82.9% in value.
New Zealand is still a privileged partner of China, especially for WMP, whose export increased by 12% in the first quarter of 2018, y-o-y. New Zealand accounts for 96% of WMP export to China, leaving the remainder to Australia, France, the U.S. and the Netherlands.
The Netherlands increased its export share, too, and confirmed its leadership in infant milk formula export to China with a 40% market share. Also its milk and cream export and WMP export increased, respectively by +74% and +27%.
| CHINA: dairy products Import year-to-date (March) | ||||||
| QUANTITY (Tons) | VALUE (‘000 USD) | |||||
| 2017 | 2018 | ± on 2017 | 2017 | 2018 | ± on 2017 | |
| Infant milk formula | 54.078 | 63.126 | +16,7% | 732.054 | 931.221 | +27,2% |
| WMP | 196.106 | 215.525 | +9,9% | 593.531 | 721.838 | +21,6% |
| Milk and cream | 121.310 | 156.388 | +28,9% | 137.254 | 197.175 | +43,7% |
| of which: | ||||||
| – Bulk and pack. milk | 98.531 | 134.328 | +36,3% | 74.745 | 119.694 | +60,1% |
| – Cream | 22.779 | 22.060 | -3,2% | 62.510 | 77.481 | +23,9% |
| Butter | 24.011 | 31.180 | +29,9% | 107.694 | 196.997 | +82,9% |
| SMP | 74.343 | 82.480 | +10,9% | 179.825 | 179.440 | -0,2% |
| Whey Powder | 122.719 | 136.777 | +11,5% | 148.240 | 144.968 | -2,2% |
| Cheese | 28.132 | 26.721 | -5,0% | 122.760 | 127.204 | +3,6% |
| Caseinates | 2.492 | 5.517 | +121,4% | 19.276 | 41.995 | +117,9% |
| Lactose Pharmaceutical | 20.403 | 22.536 | +10,5% | 18.702 | 16.370 | -12,5% |
| Yogurt and buttermilk | 6.018 | 8.199 | +36,2% | 11.706 | 16.280 | +39,1% |
| Condensed Milk | 5.184 | 5.842 | +12,7% | 9.381 | 10.860 | +15,8% |
| Lactose edible | 3.376 | 4.293 | +27,2% | 5.468 | 5.558 | +1,6% |
| TOTAL IMPORT | 658.172 | 758.586 | +15,3% | 2.085.891 | 2.589.906 | +24,2% |
| Data processed by Clal based on GTIS source. | ||||||
Do you need additional information on dairy Import/Export? Subscribe to the Dairy World Trade area on CLAL.it
CLAL.it – China Dairy Import (Value)

CLAL.it – China Dairy Import (Volumes)
The CLAL.it team is composed of young people who with the help of Computer Science study the dairy market and develop tools to provide the Operators of the dairy sector with a comprehensive real-time view of the national and international market trends.