EU export slowing down in the first quarter 2018
EU-28 exports slow down in March 2018, although the balance for the first quarter of 2018 is positive compared to the same period of the previous year. The growth of EU dairy exports in Milk Equivalent (ME) is +1.5%, the least exciting performance since 2015, comparing the same period year-over-year.
The volumes of dairy products exported from January to March 2018 increased by 2.5%, with good results for infant milk formula (+21.9%), cheese (+1.3%), SMP (+8.1%), butter (+13%) and whey powder (+9.3%).
Lower EU export prices
The decrease in the export values, however, leaves room for positive changes for infant milk formula (+14.2%), butter (+ 24.2%), cream (+13.1%) and bulk and packaged milk (+3.7%).
56% of infant milk formula exported from the EU goes to China and Hong Kong
On the other side, EU exports to China decreased for WMP (-44%), SMP (-19%) and Butter (-13%), which evidently chose at this stage the New Zealand channel, more competitive in terms of price, at least for butter and WMP.
The increase in the price of crude oil could trigger more buoyant trade relations between Europe and all those countries that base their economy on oil.
| EU-28: dairy products Export year-to-date (March) | ||||||
| QUANTITY (Tons) | VALUE (‘000 EUR) | |||||
| 2017 | 2018 | ± on 2017 | 2017 | 2018 | ± on 2017 | |
| Infant milk formula | 122.344 | 149.179 | +21,9% | 1.008.449 | 1.151.396 | +14,2% |
| Cheese | 201.523 | 204.230 | +1,3% | 962.216 | 954.829 | -0,8% |
| SMP | 191.555 | 207.067 | +8,1% | 422.456 | 346.679 | -17,9% |
| WMP | 107.383 | 94.318 | -12,2% | 380.696 | 307.616 | -19,2% |
| Butter | 44.403 | 50.183 | +13,0% | 222.699 | 276.583 | +24,2% |
| Milk and cream | 219.990 | 226.836 | +3,1% | 207.279 | 224.385 | +8,3% |
| of which: | ||||||
| – Cream | 44.543 | 44.708 | +0,4% | 100.478 | 113.678 | +13,1% |
| – Bulk and pack. milk | 175.447 | 182.129 | +3,8% | 106.801 | 110.707 | +3,7% |
| Whey Powder | 158.603 | 173.352 | +9,3% | 229.818 | 222.594 | -3,1% |
| Condensed Milk | 79.002 | 69.214 | -12,4% | 142.260 | 110.580 | -22,3% |
| Yogurt and buttermilk | 45.147 | 46.035 | +2,0% | 87.623 | 79.841 | -8,9% |
| Casein | 8.043 | 11.597 | +44,2% | 48.871 | 56.092 | +14,8% |
| Lactose Pharmaceutical | 54.275 | 46.856 | -13,7% | 65.659 | 54.509 | -17,0% |
| Caseinates | 21.962 | 5.767 | -73,7% | 74.635 | 31.307 | -58,1% |
| Lactose edible | 2.631 | 3.085 | +17,3% | 2.122 | 1.832 | -13,7% |
| TOTAL EXPORT | 1.256.862 | 1.287.720 | +2,5% | 3.854.782 | 3.818.243 | -0,9% |
| Data processed by Clal based on IHS source. | ||||||
Do you need additional information on dairy Import/Export? Subscribe to the Dairy World Trade area on CLAL.it
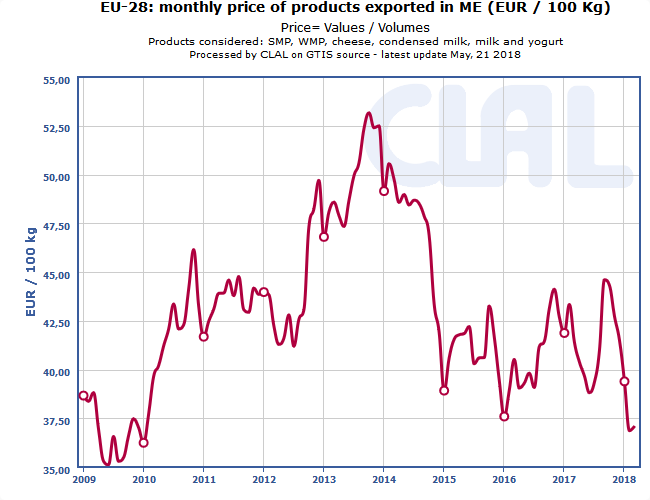
CLAL.it – EU-28: monthly price of products exported in Milk Equivalent (ME)
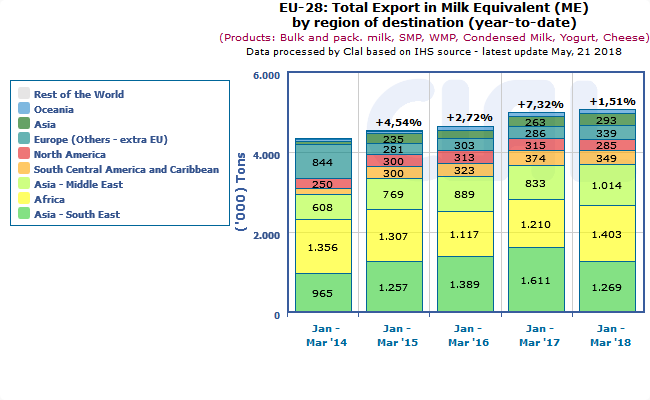
CLAL.it – EU-28: Total Export in Milk Equivalent (ME) by region of destination (year-to-date)
The CLAL.it team is composed of young people who with the help of Computer Science study the dairy market and develop tools to provide the Operators of the dairy sector with a comprehensive real-time view of the national and international market trends.