China, a strategic country for EU production
Chinese dairy figures for the month of December 2017 confirm a positive trend y-o-y both in volume and in value. Imports of cheese and WMP slowed down (respectively -19.4% and -40.5%), but recorded satisfactory level of price growth (+12% and +28.4%).
Looking at the overall numbers of 2017, the role of China on the global chessboard clearly emerges. Essential, even for the West’s economies.
+37,4% value’s growth of the Chinese dairy import in 2017
The Cheese balance is also positive: +11.2% in quantity and +18.7% in value. The growth margin of the Cheese export is high, but it is necessary to introduce Italian products to Chinese consumers, in order to make them aware of the value of the Made in Italy.
Fonterra has already started courses in Shanghai, to educate Chinese people to consume cheese.
Even the decision by the Chinese Ministry of Finance to cut import tariffs on 187 consumer goods, including some cheeses, can certainly be exploited to grow.
Not just Oceania. China is confirmed as strategic partner country also for European production.
In some fields, the dominance of New Zealand and Australia can be challenged by EU producers.
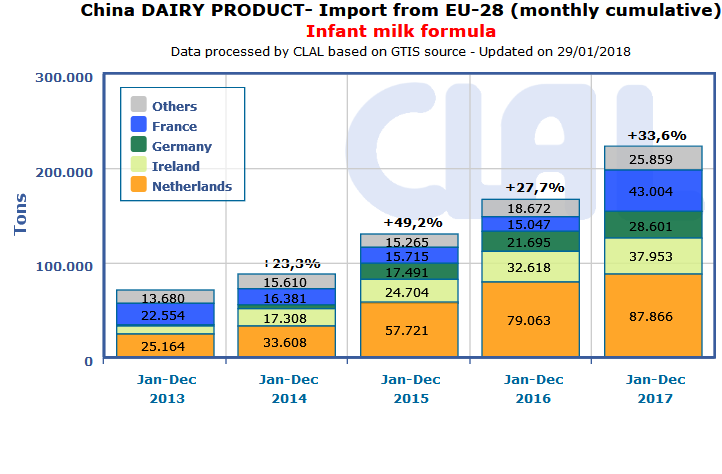
CLAL.it – CHINA: Import of Infant milk formula from European Union
This is the case, for example, of the Netherlands, leader in infant milk export, with a share of 29% and an export growth of 11% in 2017. In this context, also France has grown considerably, positioning its market share (14%) behind New Zealand (16%), with an increase in volumes exported in 2017 of 186% compared to the previous year.
France and the Netherlands grow respectively by 15% and 27% in the export of Whey Powder, placing themselves after the United States, the undisputed market leader with a market share of 55%.
New Zealand monopoly remains the export of WMP to China, with a market share of 92%, followed by a 3% of Australia, France, the U.S. and the Netherlands.
| CHINA: dairy products Import year-to-date (December) | ||||||
| QUANTITY (Tons) | VALUE (‘000 USD) | |||||
| 2016 | 2017 | ± on 2016 | 2016 | 2017 | ± on 2016 | |
| Infant milk formula | 225.328 | 302.627 | +34,3% | 3.072.427 | 4.072.941 | +32,6% |
| WMP | 419.749 | 470.096 | +12,0% | 1.081.977 | 1.561.320 | +44,3% |
| Milk and cream | 634.102 | 667.556 | +5,3% | 639.735 | 879.352 | +37,5% |
| of which: | ||||||
| – Cream | 85.525 | 138.635 | +62,1% | 233.817 | 446.195 | +90,8% |
| – Bulk and pack. milk | 548.576 | 528.922 | -3,6% | 405.918 | 433.157 | +6,7% |
| Whey Powder | 497.221 | 529.629 | +6,5% | 452.387 | 666.351 | +47,3% |
| SMP | 184.469 | 247.304 | +34,1% | 396.192 | 600.433 | +51,6% |
| Butter | 81.865 | 91.566 | +11,8% | 303.150 | 500.158 | +65,0% |
| Cheese | 97.179 | 108.035 | +11,2% | 419.406 | 497.725 | +18,7% |
| Caseinates | 16.174 | 13.975 | -13,6% | 106.435 | 112.035 | +5,3% |
| Lactose Pharmaceutical | 76.777 | 75.788 | -1,3% | 54.530 | 73.261 | +34,3% |
| Yogurt and buttermilk | 20.988 | 34.156 | +62,7% | 42.167 | 66.878 | +58,6% |
| Condensed Milk | 20.013 | 25.648 | +28,2% | 36.449 | 46.348 | +27,2% |
| Lactose edible | 10.323 | 12.082 | +17,0% | 15.743 | 20.221 | +28,4% |
| TOTAL IMPORT | 2.284.188 | 2.578.462 | +12,9% | 6.620.598 | 9.097.023 | +37,4% |
| Data processed by Clal based on GTIS source. | ||||||
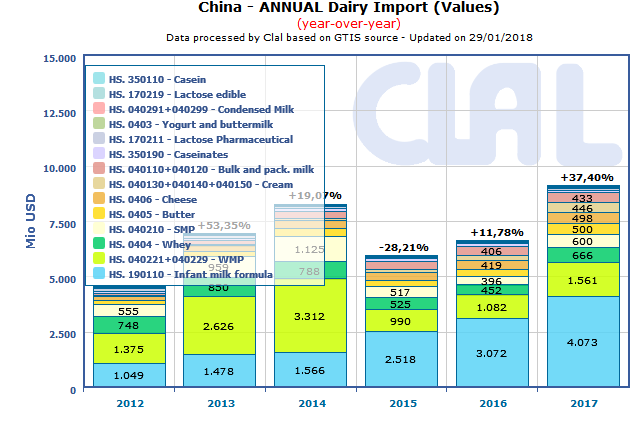
CLAL.it – China: dairy import (value)
Do you need additional information on dairy Import/Export? Subscribe to the Dairy World Trade area on CLAL.it
The CLAL.it team is composed of young people who with the help of Computer Science study the dairy market and develop tools to provide the Operators of the dairy sector with a comprehensive real-time view of the national and international market trends.