EU-28: EXPORT BOOM in 2015 (Jan-Dec). But what about proceeds?
EU-28 exports in December 2015 compared to December 2014 increased in volumes for Butter (+73.2%), Whey Powder (+16.2%), Cheese (+10.8%), Condensed Milk (+9.4%), WMP (+7.6%), Infant milk formula (+2.0%), SMP (+1.6%).
From January to December 2015 y-o-y the exports growth accounted for 16,28% of the increase in milk deliveries. In fact:
- EU milk deliveries increased by 2,44% (3.616.579 Tons)
- Extra-EU exports of cheese, milk powders, butter, condensed milk and liquid milk increased in “milk equivalent” increased by 3,32% (588.780 Tons)
The value of exports was 13.204 Mio €; the value of imports was 743 Mio €, so the commercial balance is positive (trade surplus: 12.461 Mio €)
The main regions importing European dairy products (cheese, milk powders, butter, condensed milk and liquid milk) were:
- Africa import, accounting for 28% of market share, decreased by 9.4%
- Asia – South East import, accounting for 26% of market share, increased by 25.4%
- Asia – Middle East import, accounting for 18% of market share, increased by 15.7%
- North America import, accounting for 8% of market share, increased by 14.7%
- Europe (Others – extra EU) import, accounting for 7% of market share, decreased by 52%
| EU-28: dairy products Export year-to-date (December) | |||||||||||||||||||||||||||||||||||||
| QUANTITY (Tons) | VALUE (‘000 EUR) | ||||||||||||||||||||||||||||||||||||
| 2014 | 2015 | ± on 2014 | 2014 | 2015 | ± on 2014 | ||||||||||||||||||||||||||||||||
| Infant milk formula | 403.443 | 426.739 | +5,8% | 3.390.905 | 3.688.642 | +8,8% | |||||||||||||||||||||||||||||||
| Cheese | 720.607 | 718.975 | -0,2% | 3.602.432 | 3.483.794 | -3,3% | |||||||||||||||||||||||||||||||
| SMP | 647.924 | 684.274 | +5,6% | 1.970.810 | 1.495.739 | -24,1% | |||||||||||||||||||||||||||||||
| WMP | 389.736 | 389.984 | +0,1% | 1.511.974 | 1.224.277 | -19,0% | |||||||||||||||||||||||||||||||
| Whey Powder | 569.114 | 604.874 | +6,3% | 965.062 | 862.313 | -10,6% | |||||||||||||||||||||||||||||||
| Butter | 147.858 | 185.437 | +25,4% | 636.249 | 721.099 | +13,3% | |||||||||||||||||||||||||||||||
| Condensed Milk | 301.753 | 333.518 | +10,5% | 546.791 | 570.369 | +4,3% | |||||||||||||||||||||||||||||||
| Bulk and pack. milk | 559.654 | 708.243 | +26,6% | 351.024 | 416.749 | +18,7% | |||||||||||||||||||||||||||||||
| Casein | 39.203 | 40.537 | +3,4% | 300.359 | 267.610 | -10,9% | |||||||||||||||||||||||||||||||
| Caseinates | 39.404 | 52.086 | +32,2% | 291.421 | 266.942 | -8,4% | |||||||||||||||||||||||||||||||
| Lactose Pharmaceutical | 162.516 | 157.910 | -2,8% | 235.252 | 196.606 | -16,4% | |||||||||||||||||||||||||||||||
| Lactose edible | 11.410 | 8.299 | -27,3% | 14.346 | 9.972 | -30,5% | |||||||||||||||||||||||||||||||
| TOTAL EXPORT | 3.992.621 | 4.310.875 | +8,0% | 13.816.625 | 13.204.114 | -4,4% | |||||||||||||||||||||||||||||||
| Data processed by Clal based on GTIS source. | |||||||||||||||||||||||||||||||||||||
|
|||||||||||||||||||||||||||||||||||||
|
EU-28: CHEESE EXPORT Main IMPORTERS of 2015 Period: January-December |
|||||
| Ton | Share 2015 |
2013 | 2014 | 2015 | % on 2014 |
| TOTAL | 786.241 | 720.607 | 718.975 | -0% | |
| United States | 19% | 112.939 | 119.969 | 140.170 | +17% |
| Japan | 10% | 40.814 | 46.293 | 68.663 | +48% |
| Switzerland | 8% | 51.762 | 53.723 | 54.807 | +2% |
| Saudi Arabia | 5% | 22.181 | 31.105 | 38.589 | +24% |
| Korea, South | 5% | 9.912 | 21.927 | 35.098 | +60% |
|
EU-28: SMP EXPORT Main IMPORTERS of 2015 Period: January-December |
|||||
| Ton | Share 2015 |
2013 | 2014 | 2015 | % on 2014 |
| TOTAL | 406.741 | 647.924 | 684.274 | +6% | |
| Algeria | 16% | 58.545 | 145.252 | 107.432 | -26% |
| Egypt | 8% | 23.586 | 47.693 | 58.063 | +22% |
| China | 8% | 47.082 | 62.579 | 53.499 | -15% |
| Indonesia | 7% | 41.426 | 45.824 | 46.301 | +1% |
| Philippines | 4% | 8.024 | 16.947 | 30.039 | +77% |
|
EU-28: BUTTER EXPORT Main IMPORTERS of 2015 Period: January-December |
|||||
| Ton | Share 2015 |
2013 | 2014 | 2015 | % on 2014 |
| TOTAL | 127.568 | 147.858 | 185.437 | +25% | |
| China | 13% | 3.105 | 4.487 | 24.837 | +454% |
| United States | 10% | 4.123 | 9.570 | 18.260 | +91% |
| Saudi Arabia | 9% | 5.984 | 13.265 | 17.569 | +32% |
| Egypt | 7% | 1.300 | 5.188 | 13.827 | +167% |
| Turkey | 5% | 4.885 | 5.524 | 9.454 | +71% |
Do you need additional information on dairy Import/Export? Subscribe to the Dairy World Trade area on CLAL.it
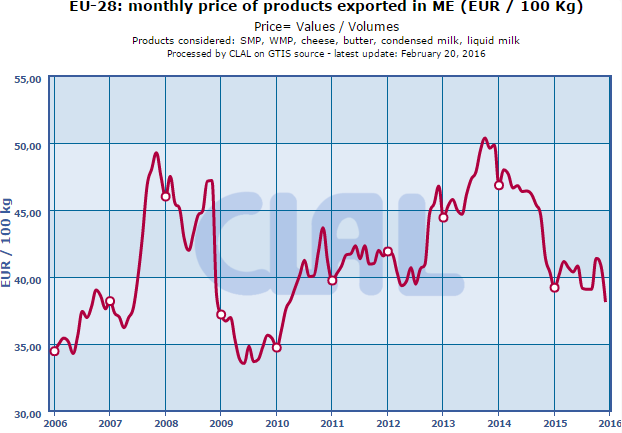
CLAL.it – EU-28: monthly price of products exported in Milk Equivalent (ME)
The CLAL.it team is composed of young people who with the help of Computer Science study the dairy market and develop tools to provide the Operators of the dairy sector with a comprehensive real-time view of the national and international market trends.
Leave a Reply
You must be registered and logged in to post a comment.