From China to Mexico: U.S. dairy export flies
Between January and April 2017, US dairy products increased their trend-based exports both in volume (+13.5%) and in value (+22.5%).
Main destination countries were Mexico, Central and Latin America, followed by China and Southeast Asia. Asean area had a strong growth.
Overall, total exports in milk equivalent (ME) by region grew by 15.29%, while total imports in milk equivalent were down 7.93%.
The first supply area of dairy products is the European Union, from which the US purchases 400,000 tonnes of milk equivalents.
The most exported products are cheeses, skimmed milk powder (SMP), whey powder, infant-formula milk, lactose for pharmaceutical use, but also milk and cream.
No wall between the United States and Mexico, which remains the first country for market share in cheese and SMP exports.
Warning to American evolutions, in cheese sector in particular. US dairy industry is looking for a strong identity for its production, keeping away from the standardization. The mission is a linked in “terroir” production.
| UNITED STATES: dairy products Export year-to-date (April) | |||||||||||||||||||||||||||||||||||||
| QUANTITY (Tons) | VALUE (‘000 USD) | ||||||||||||||||||||||||||||||||||||
| 2016 | 2017 | ± on 2016 | 2016 | 2017 | ± on 2016 | ||||||||||||||||||||||||||||||||
| Cheese | 93.481 | 107.596 | +15,1% | 388.211 | 460.605 | +18,6% | |||||||||||||||||||||||||||||||
| SMP | 171.652 | 204.385 | +19,1% | 345.710 | 449.072 | +29,9% | |||||||||||||||||||||||||||||||
| Whey Powder | 137.970 | 170.654 | +23,7% | 175.179 | 240.229 | +37,1% | |||||||||||||||||||||||||||||||
| Infant milk formula | 10.799 | 13.043 | +20,8% | 94.747 | 97.063 | +2,4% | |||||||||||||||||||||||||||||||
| Lactose Pharmaceutical | 79.540 | 86.420 | +8,6% | 59.612 | 87.604 | +47,0% | |||||||||||||||||||||||||||||||
| Milk and cream | 29.924 | 34.164 | +14,2% | 27.374 | 36.984 | +35,1% | |||||||||||||||||||||||||||||||
| Butter | 12.959 | 8.485 | -34,5% | 46.327 | 35.688 | -23,0% | |||||||||||||||||||||||||||||||
| Other products* | 60.364 | 52.600 | -12,9% | 94.351 | 101.140 | +7,2% | |||||||||||||||||||||||||||||||
| TOTAL EXPORT | 596.688 | 677.348 | +13,5% | 1.231.511 | 1.508.385 | +22,5% | |||||||||||||||||||||||||||||||
| * Other products: Lactose edible, Yogurt and buttermilk, WMP, Condensed Milk, Caseinates, Casein Data processed by Clal based on GTIS source. |
|||||||||||||||||||||||||||||||||||||
|
|||||||||||||||||||||||||||||||||||||
| United States: CHEESE EXPORT Main IMPORTERS of 2017 Period: January-April |
|||||
| Ton | Share 2017 |
2015 | 2016 | 2017 | % on 2016 |
| TOTAL | 120.133 | 93.481 | 107.596 | +15% | |
| Mexico | 29% | 31.424 | 30.911 | 31.073 | +1% |
| Korea, South | 16% | 27.144 | 12.635 | 17.287 | +37% |
| Japan | 9% | 14.029 | 10.189 | 9.577 | -6% |
| Australia | 9% | 7.458 | 4.216 | 9.234 | +119% |
| Canada | 4% | 4.076 | 3.939 | 4.412 | +12% |
| United States: SMP EXPORT Main IMPORTERS of 2017 Period: January-April |
|||||
| Ton | Share 2017 |
2015 | 2016 | 2017 | % on 2016 |
| TOTAL | 181.555 | 171.652 | 204.385 | +19% | |
| Mexico | 45% | 76.728 | 78.647 | 91.999 | +17% |
| Philippines | 11% | 21.350 | 28.587 | 22.379 | -22% |
| China | 7% | 10.821 | 5.327 | 14.177 | +166% |
| Indonesia | 5% | 13.257 | 10.777 | 11.125 | +3% |
| Malaysia | 5% | 9.064 | 6.598 | 10.913 | +65% |
Do you need additional information on dairy Import/Export? Subscribe to the Dairy World Trade area on CLAL.it
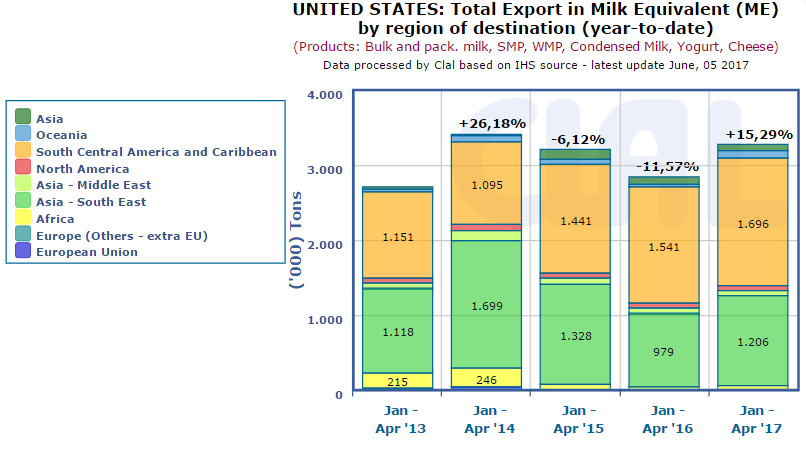
CLAL.it – United States: Total Export in Milk Equivalent (ME) by region of destination (year-to-date)
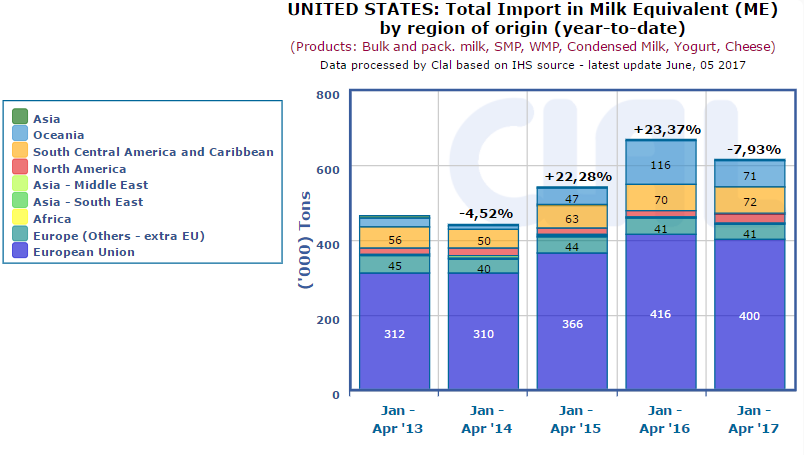
CLAL.it – United States: Total Import in Milk Equivalent (ME) by region of origin (year-to-date)
The CLAL.it team is composed of young people who with the help of Computer Science study the dairy market and develop tools to provide the Operators of the dairy sector with a comprehensive real-time view of the national and international market trends.
Leave a Reply
You must be registered and logged in to post a comment.