More Italian Cheese on global market
While the EU trend in the first three months saw an increase in quantity (+2.5% y-o-y) and a decrease in value (-0.9%), the Italian dairy sector recorded a diametrically opposite trend, with a decrease in export in quantity (-5.6%), but a good performance in terms of value, which even grew by 4.9% on a trend basis. Does it mean that Italian dairy products can rely on a brand with higher added value?
Italy Cheese Export
+3.7%in volume
+8.0%in value
Jan-Mar 2018
Of course. Italian cheese exports expanded in the first quarter 2018: +3.7% in volume and +8% in value, with positive performance for Grana Padano and Parmigiano Reggiano (+6.6% in quantity and +6% in value), Gorgonzola (+5.9% in quantity and +8.6% in value), Provolone (+ 25.3% in quantity and + 21.6% in value), Fresh Cheeses such as Mozzarella and Ricotta (+ 4.1% in quantity and +10.7% in value), Grated or powdered cheese (+9.8% in quantity and + 15.4% in value).
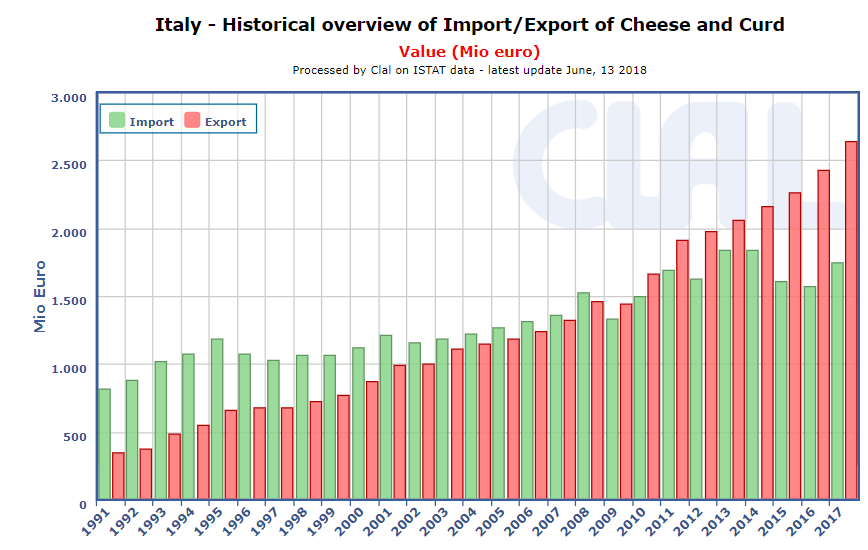
If Italian exports of cheese and dairy products grow at an annual rate of 3.7%, even imports are advancing and increasing +5%. These dynamics show, also for the first quarter of 2018, a deficit in the trade balance.
Grana Padano and Parmigiano Reggiano increased the volumes exported in the first three target markets: Germany (+2%), United States (+1%) and France (+7%), while they lost ground in the United Kingdom (-1%).
The growth of Fresh Cheeses, including Mozzarella and Ricotta (+ 4%), was also positive, even if it showed a decline towards France (-9%) and the United Kingdom (-5%). Sales to Germany, on the other hand, increased (+12%).
The positive trend of exports of Grated or Powdered Cheeses continued in the first quarter 2018: +10%, with an acceleration for Germany (+12%) and France (+13%), on a trend basis.
Even the Gorgonzola between January and March 2018 improved the performance: +6% y-o-y.
| ITALIA: dairy products Export year-to-date (March) | ||||||
| QUANTITY (Tons) | VALUE (‘000 ) | |||||
| 2017 | 2018 | ± on 2017 | 2017 | 2018 | ± on 2017 | |
| Cheese | 90.799 | 94.183 | +3,7% | 576.015 | 622.279 | +8,0% |
| of which: | ||||||
| – G.Padano and P.Reggiano | 20.055 | 21.374 | +6,6% | 198.628 | 210.529 | +6,0% |
| – Fresh cheeses incl. mozzarella, cheese and ricotta |
29.270 | 30.478 | +4,1% | 118.015 | 130.599 | +10,7% |
| – Grated or powered cheeses | 9.931 | 10.908 | +9,8% | 80.784 | 93.200 | +15,4% |
| – Pecorino and Fiore Sardo | 4.803 | 4.152 | -13,6% | 31.493 | 33.660 | +6,9% |
| – Gorgonzola | 4.840 | 5.127 | +5,9% | 29.081 | 31.585 | +8,6% |
| – Provolone | 1.401 | 1.755 | +25,3% | 8.106 | 9.857 | +21,6% |
| – Asiago, Montasio, Ragusano, Caciocavallo |
469 | 376 | -19,9% | 3.091 | 2.435 | -21,2% |
| Whey | 115.828 | 111.023 | -4,1% | 47.192 | 36.014 | -23,7% |
| Milk and cream | 23.777 | 13.349 | -43,9% | 22.538 | 19.266 | -14,5% |
| of which: | ||||||
| – Bulk milk cream | 7.773 | 4.522 | -41,8% | 11.788 | 11.754 | -0,3% |
| – Packaged milk | 12.603 | 5.722 | -54,6% | 7.803 | 4.141 | -46,9% |
| – Packaged milk cream | 773 | 1.390 | +79,7% | 1.350 | 3.007 | +122,8% |
| – Bulk milk | 2.628 | 1.716 | -34,7% | 1.598 | 365 | -77,2% |
| Butter | 1.873 | 1.894 | +1,1% | 7.962 | 9.877 | +24,0% |
| SMP | 1.435 | 1.554 | +8,3% | 5.019 | 4.743 | -5,5% |
| Lactose Pharm. | 7.160 | 6.159 | -14,0% | 4.366 | 3.441 | -21,2% |
| Other ferm.milks | 639 | 655 | +2,6% | 3.286 | 3.239 | -1,4% |
| WMP | 474 | 510 | +7,6% | 1.765 | 2.772 | +57,1% |
| Yogurt | 1.082 | 811 | -25,0% | 2.012 | 1.731 | -13,9% |
| Cond. milk | 1.323 | 869 | -34,3% | 1.306 | 1.216 | -6,9% |
| Other products* | 827 | 543 | -34,3% | 2.181 | 1.859 | -14,7% |
| TOTAL EXPORT | 245.216 | 231.551 | -5,6% | 673.640 | 706.437 | +4,9% |
|
* Other products: Infant milk formula, Casein, Caseinates, Lactose edible Data processed by Clal based on ISTAT source. |
||||||
View Italy’s Import/Export summary on CLAL.it.
Do you need additional information on dairy Import/Export? Subscribe to the Dairy World Trade area on CLAL.it
CLAL.it – Italy: Import/Export of Cheese and Curd (Mio Euro)
The CLAL.it team is composed of young people who with the help of Computer Science study the dairy market and develop tools to provide the Operators of the dairy sector with a comprehensive real-time view of the national and international market trends.