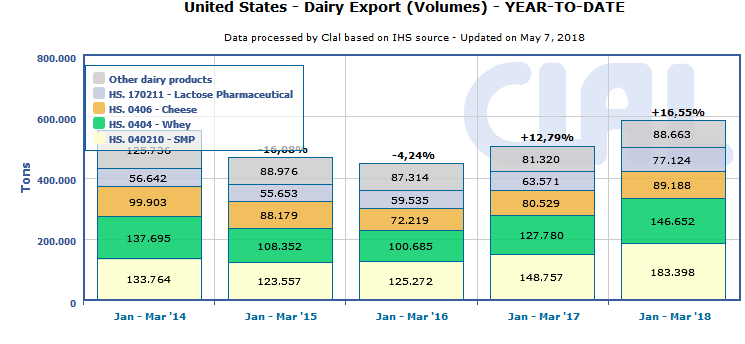
U.S. dairy exports hit a record in March
In March, the US dairy export continues, supported by increasing prices for milk, cheese, milk powders, butter and cream. Also the US dollar getting weaker against the Euro makes US products more competitive on the international market.
United States+23,6% dairy export
March 2018 y-o-y
in quantity
Thanks to the sales overseas, the US manage to place the production surplus and the strategy launched by U.S. Dairy Export Council has been renamed “The next 5%”, meaning the increase in exports, to be achieved through a more aggressive policy on global markets.
The Next 5% is the industry-wide effort launched to increase U.S. dairy exports from the equivalent of about 15% of milk solids to 20% of the milk supply.
Positive exports of SMP, cheese, butter and WMP, in March 2018 y-o-y, both in quantity and in value, while whey powder grows in quantity but decreases in value. On the contrary, infant milk formula increases in value, while volumes fall.
For the coming months, it will be interesting to see how the trade flows will be regulates with China, in light of tensions on tariffs. The negotiations between Washington and Beijing are still ongoing and the results are absolutely unpredictable.
In the first quarter of the current year, US export to China increased for cheese (+57%), whey powder (+4%), infant milk formula (+153%) and lactose pharmaceutical (+76%). On the other hand, exports of SMP decreased by 52%.
Trade relationships with Mexico remain strong, with sales up, while exports to Canada are slowing down: +44% for cheese, -24% for whey powder, -8% for infant milk formula.
The US export route to Japan and South-East Asia was extremely lively.
| UNITED STATES: dairy products Export year-to-date (March) | ||||||
| QUANTITY (Tons) | VALUE (‘000 USD) | |||||
| 2017 | 2018 | ± on 2017 | 2017 | 2018 | ± on 2017 | |
| Cheese | 80.529 | 89.188 | +10,8% | 347.980 | 374.547 | +7,6% |
| SMP | 148.757 | 183.398 | +23,3% | 331.300 | 337.306 | +1,8% |
| Whey Powder | 127.780 | 146.652 | +14,8% | 178.313 | 167.295 | -6,2% |
| Infant milk formula | 10.573 | 9.150 | -13,5% | 75.013 | 89.154 | +18,9% |
| Lactose Pharmaceutical | 63.571 | 77.124 | +21,3% | 64.381 | 62.099 | -3,5% |
| Butter | 6.004 | 9.587 | +59,7% | 25.053 | 36.920 | +47,4% |
| WMP | 6.642 | 10.624 | +60,0% | 17.311 | 25.893 | +49,6% |
| Milk and cream | 25.635 | 25.882 | +1,0% | 27.335 | 24.733 | -9,5% |
| of which: | ||||||
| – Bulk and pack. milk | 18.251 | 20.262 | +11,0% | 16.397 | 19.236 | +17,3% |
| – Cream | 7.384 | 5.620 | -23,9% | 10.938 | 5.497 | -49,7% |
| Yogurt and buttermilk | 3.980 | 3.630 | -8,8% | 21.015 | 17.195 | -18,2% |
| Lactose edible | 23.698 | 25.422 | +7,3% | 21.022 | 16.897 | -19,6% |
| Condensed Milk | 3.890 | 3.434 | -11,7% | 8.163 | 7.434 | -8,9% |
| Caseinates | 463 | 712 | +53,9% | 3.735 | 6.231 | +66,8% |
| Casein | 435 | 224 | -48,6% | 3.254 | 1.757 | -46,0% |
| TOTAL EXPORT | 501.957 | 585.026 | +16,5% | 1.123.874 | 1.167.460 | +3,9% |
| Data processed by Clal based on GTIS source. | ||||||
Do you need additional information on dairy Import/Export? Subscribe to the Dairy World Trade area on CLAL.it
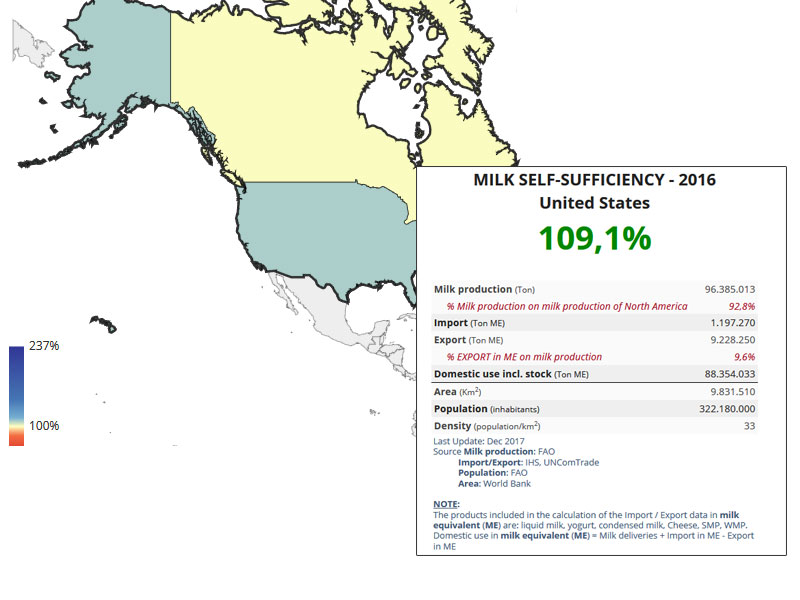
CLAL.it – U.S. is a milk-surplus country
CLAL.it – U.S. dairy exports in the first quarter of 2018
The CLAL.it team is composed of young people who with the help of Computer Science study the dairy market and develop tools to provide the Operators of the dairy sector with a comprehensive real-time view of the national and international market trends.