China imports in June 2016 compared to June 2015 increased in volumes for:
- WMP (+120.2%)
- Milk and cream (+43.9%)
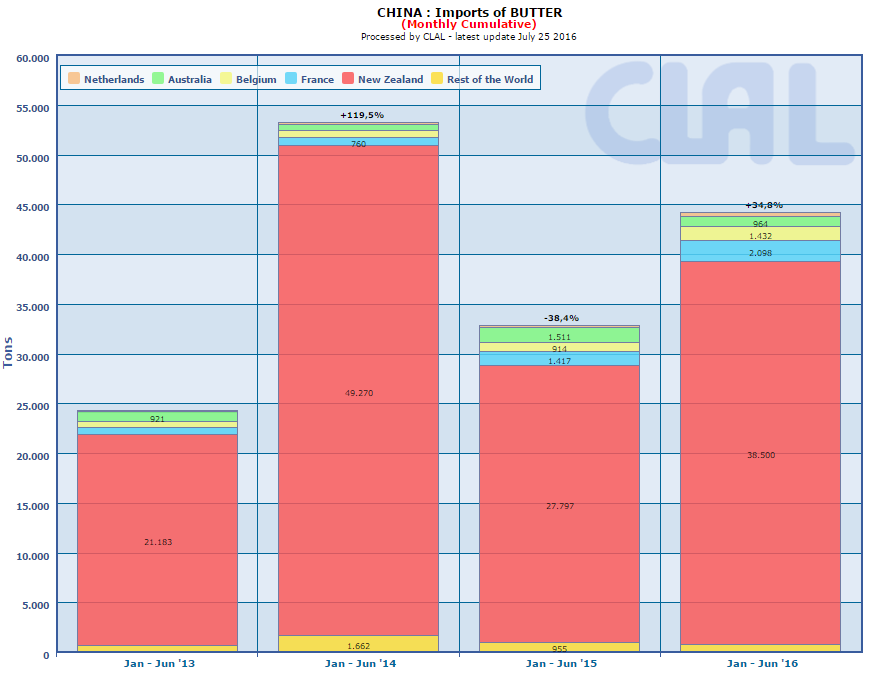
- Butter (+40.7%)
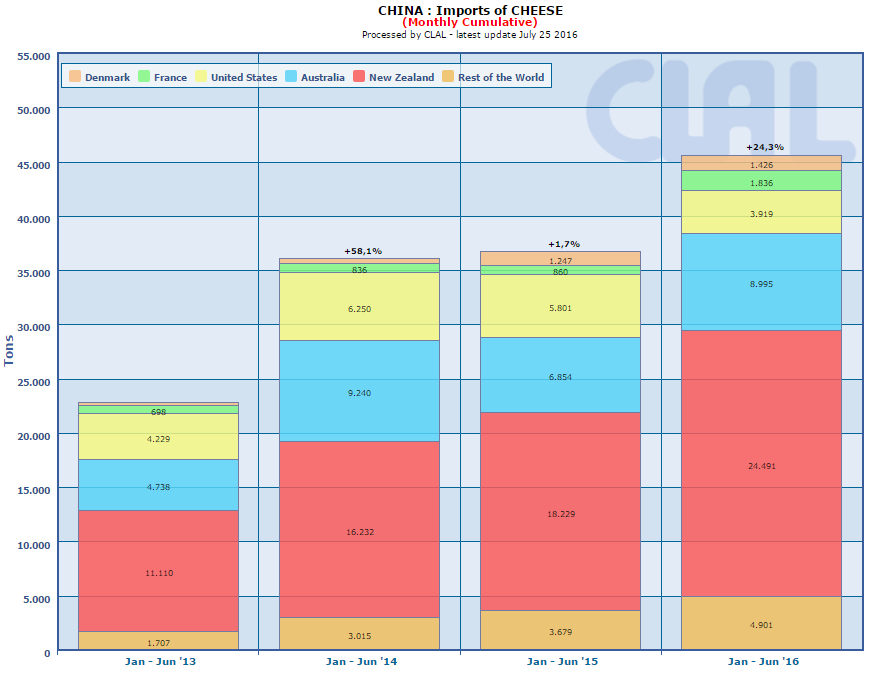
- Cheese (+27.7%)
- Infant milk formula (+18.0%)
decreased for:
- Whey Powder (-0.5%)
- SMP (-15.7%)
| CHINA: dairy products Import year-to-date (June) | ||||||
| QUANTITY (Tons) | VALUE (’000 USD) | |||||
| 2015 | 2016 | ± on 2015 | 2015 | 2016 | ± on 2015 | |
| Infant milk formula | 76.706 | 96.222 | +25,4% | 1.050.915 | 1.318.525 | +25,5% |
| WMP | 235.516 | 293.959 | +24,8% | 659.368 | 736.435 | +11,7% |
| Milk and cream | 177.204 | 314.728 | +77,6% | 201.915 | 315.188 | +56,1% |
| SMP | 108.506 | 113.876 | +4,9% | 296.866 | 246.526 | -17,0% |
| Whey Powder | 199.475 | 231.412 | +16,0% | 275.961 | 206.580 | -25,1% |
| Cheese | 36.669 | 45.567 | +24,3% | 173.697 | 194.618 | +12,0% |
| Butter | 32.768 | 44.174 | +34,8% | 126.801 | 159.817 | +26,0% |
| Other products* | 61.897 | 73.144 | +18,2% | 150.460 | 128.984 | -14,3% |
| TOTAL IMPORT | 928.741 | 1.213.084 | +30,6% | 2.935.982 | 3.306.672 | +12,6% |
| * Other products: Caseinates, Lactose Pharmaceutical, Yogurt and buttermilk, Condensed Milk, Lactose edible Data processed by Clal based on GTIS source. |
||||||
| China: CHEESE IMPORT Main EXPORTERS of 2016 Period: January-June |
|||||
| Ton | Share 2016 |
2014 | 2015 | 2016 | % on 2015 |
| TOTAL | 36.055 | 36.669 | 45.567 | +24% | |
| New Zealand | 54% | 16.232 | 18.229 | 24.491 | +34% |
| Australia | 20% | 9.240 | 6.854 | 8.995 | +31% |
| USA | 9% | 6.250 | 5.801 | 3.919 | -32% |
| France | 4% | 836 | 860 | 1.836 | +114% |
| Denmark | 3% | 481 | 1.247 | 1.426 | +14% |
| China: BUTTER IMPORT Main EXPORTERS of 2016 Period: January-June |
|||||
| Ton | Share 2016 |
2014 | 2015 | 2016 | % on 2015 |
| TOTAL | 53.187 | 32.768 | 44.174 | +35% | |
| New Zealand | 87% | 49.270 | 27.797 | 38.500 | +39% |
| France | 5% | 760 | 1.417 | 2.098 | +48% |
| Belgium | 3% | 689 | 914 | 1.432 | +57% |
| Australia | 2% | 678 | 1.511 | 964 | -36% |
| Netherlands | 1% | 129 | 173 | 410 | +137% |
Do you need additional information on dairy Import/Export? Subscribe to the Dairy World Trade area on CLAL.it


[…] From CLAL.it […]