China’s interest in packed dairy products still high
China imports in May 2016 compared to May 2015 increased in volumes for:
- Milk and cream (+110.9%)
- Infant milk formula (+32.8%)
- WMP (+18.2%)
- Whey Powder (+10.2%)
- Cheese (+9.7%)
decreased for:
- SMP (-13.2%)
- Butter (-18.2%)
| CHINA: dairy products Import year-to-date (May) | ||||||
| QUANTITY (Tons) | VALUE (‘000 USD) | |||||
| 2015 | 2016 | ± on 2015 | 2015 | 2016 | ± on 2015 | |
| Infant milk formula | 61.519 | 78.294 | +27,3% | 844.701 | 1.078.355 | +27,7% |
| WMP | 223.135 | 266.692 | +19,5% | 620.630 | 662.496 | +6,7% |
| Milk and cream | 138.967 | 259.691 | +86,9% | 162.144 | 257.832 | +59,0% |
| of which: | ||||||
| – Packed Milk | 121.749 | 226.072 | +85,7% | 113.013 | 168.606 | +49,2% |
| SMP | 90.908 | 99.035 | +8,9% | 249.710 | 210.846 | -15,6% |
| Whey Powder | 155.063 | 187.241 | +20,8% | 225.190 | 170.267 | -24,4% |
| Cheese | 30.314 | 37.455 | +23,6% | 144.735 | 160.405 | +10,8% |
| Butter | 27.996 | 37.458 | +33,8% | 105.611 | 134.421 | +27,3% |
| Other products* | 52.197 | 59.534 | +14,1% | 131.206 | 105.882 | -19,3% |
| TOTAL IMPORT | 780.099 | 1.025.400 | +31,4% | 2.483.927 | 2.780.505 | +11,9% |
|
* Other products: Caseinates, Lactose Pharmaceutical, Yogurt and buttermilk, Condensed Milk, Lactose edible Data processed by Clal based on GTIS source. |
||||||
|
China: MILK AND CREAM IMPORT Main EXPORTERS of 2016 Period: January-May |
|||||
| Ton | Share 2016 |
2014 | 2015 | 2016 | % on 2015 |
| TOTAL | 113.096 | 138.967 | 259.691 | +87% | |
| Germany | 36% | 46.408 | 51.287 | 94.742 | +85% |
| France | 19% | 14.536 | 12.112 | 48.301 | +299% |
| New Zealand | 18% | 16.817 | 24.704 | 47.393 | +92% |
| Australia | 11% | 11.410 | 22.888 | 29.351 | +28% |
| Poland | 4% | 2.612 | 2.921 | 9.407 | +222% |
| United Kingdom | 2% | 3.622 | 3.953 | 4.567 | +16% |
|
China: CHEESE IMPORT Main EXPORTERS of 2016 Period: January-May |
|||||
| Ton | Share 2016 |
2014 | 2015 | 2016 | % on 2015 |
| TOTAL | 30.399 | 30.314 | 37.455 | +24% | |
| New Zealand | 55% | 13.953 | 16.057 | 20.591 | +28% |
| Australia | 18% | 7.249 | 4.835 | 6.801 | +41% |
| United States | 9% | 5.530 | 4.624 | 3.205 | -31% |
| France | 4% | 708 | 740 | 1.644 | +122% |
| Denmark | 3% | 407 | 1.021 | 1.282 | +26% |
| Italy | 3% | 688 | 810 | 986 | +22% |
Do you need additional information on dairy Import/Export? Subscribe to the Dairy World Trade area on CLAL.it

CLAL.it – China: Total dairy IMPORT (monthly cumulative)
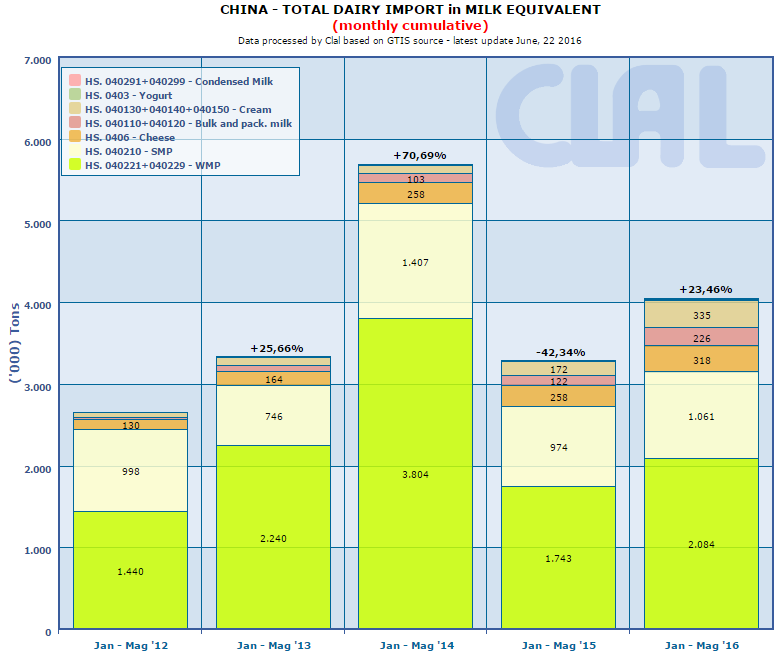
CLAL.it – China: Total dairy IMPORT in Milk Equivalent (monthly cumulative)
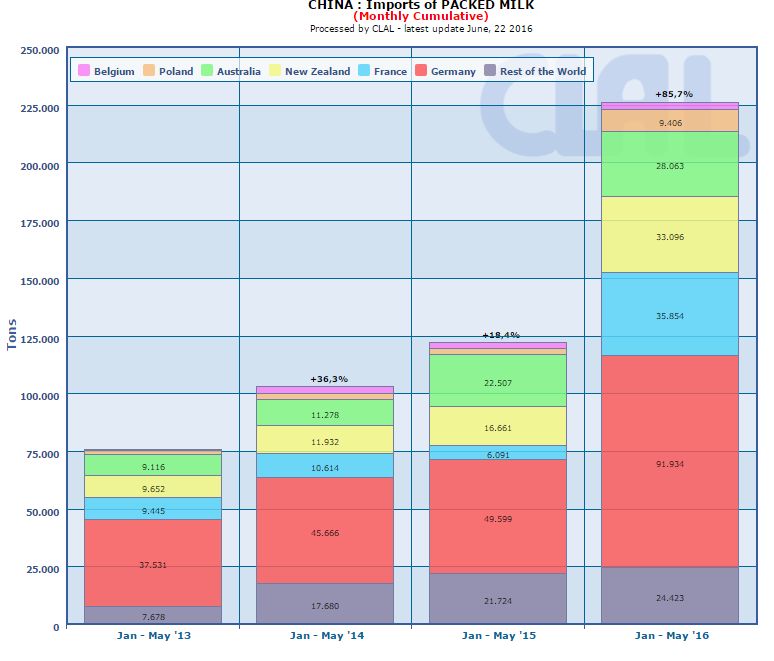
CLAL.it – China: Imports of packed milk (monthly cumulative)
The CLAL.it team is composed of young people who with the help of Computer Science study the dairy market and develop tools to provide the Operators of the dairy sector with a comprehensive real-time view of the national and international market trends.
Leave a Reply
You must be registered and logged in to post a comment.