EU: dairy export and milk production rise
EU exports in January-April 2017 grew (+1.3% on a trend basis), with a strong acceleration in value: +12.8%, especially in SMP and WMP values.
EU is living a positive phase for internationalization. Also exports in milk equivalents (ME) have grown by 7.9% in the first four months of the year. South-East Asia is the first destination area. The other key point defining a good phase is the results of the annual export (May 2016-April 2017): +139,000 tonnes exported, in milk equivalent (ME).
Between January and April have a good export performance Cheese (+7.4%) and SMP (+13.3%), which draw interesting profits in value, respectively + 12% and +26.7%.
The most increased trade routes: Japan, South Korea and Chile for cheese. Mexico, China and Algeria for SMP.
Food exports slow down. Is this a temporary weakness or new world market needs?
| EU-28: dairy products Export year-to-date (April) | ||||||
| QUANTITY (Tons) | VALUE (‘000 EUR) | |||||
| 2016 | 2017 | ± on 2016 | 2016 | 2017 | ± on 2016 | |
| Infant milk formula | 148.993 | 163.170 | +9,5% | 1.255.812 | 1.350.029 | +7,5% |
| Cheese | 254.047 | 272.841 | +7,4% | 1.153.998 | 1.292.867 | +12,0% |
| SMP | 228.037 | 258.382 | +13,3% | 446.682 | 565.939 | +26,7% |
| WMP | 129.999 | 137.376 | +5,7% | 390.019 | 488.346 | +25,2% |
| Butter | 86.185 | 63.408 | -26,4% | 311.374 | 319.804 | +2,7% |
| Whey Powder | 210.242 | 215.638 | +2,6% | 272.375 | 313.303 | +15,0% |
| Milk and cream | 360.629 | 296.611 | -17,8% | 274.519 | 278.856 | +1,6% |
| Condensed Milk | 92.565 | 102.640 | +10,9% | 155.523 | 181.754 | +16,9% |
| Yogurt and buttermilk | 57.670 | 59.518 | +3,2% | 104.372 | 114.496 | +9,7% |
| Caseinates | 28.388 | 27.997 | -1,4% | 81.990 | 97.392 | +18,8% |
| Lactose Pharmaceutical | 50.054 | 70.083 | +40,0% | 56.408 | 85.841 | +52,2% |
| Casein | 11.295 | 10.680 | -5,5% | 62.478 | 65.462 | +4,8% |
| Other products* | 3.258 | 3.833 | +17,6% | 4.403 | 3.046 | -30,8% |
| TOTAL EXPORT | 1.661.361 | 1.682.176 | +1,3% | 4.569.954 | 5.157.135 | +12,8% |
|
* Other products: Lactose edible Data processed by Clal based on GTIS source. |
||||||
|
EU-28: CHEESE EXPORT Main IMPORTERS of 2017 Period: January-April |
|||||
| Ton | Share 2017 |
2015 | 2016 | 2017 | % on 2016 |
| TOTAL | 222.732 | 254.047 | 272.841 | +7% | |
| United States | 16% | 42.108 | 43.396 | 43.171 | -1% |
| Japan | 12% | 19.994 | 22.595 | 31.538 | +40% |
| Switzerland | 7% | 17.717 | 18.166 | 19.361 | +7% |
| Korea, South | 7% | 12.288 | 15.508 | 19.110 | +23% |
| Saudi Arabia | 6% | 11.566 | 17.202 | 15.422 | -10% |
|
EU-28: SMP EXPORT Main IMPORTERS of 2017 Period: January-April |
|||||
| Ton | Share 2017 |
2015 | 2016 | 2017 | % on 2016 |
| TOTAL | 253.463 | 228.037 | 258.382 | +13% | |
| Algeria | 14% | 41.842 | 31.837 | 36.899 | +16% |
| China | 11% | 14.985 | 19.646 | 28.077 | +43% |
| Indonesia | 10% | 19.044 | 19.295 | 24.722 | +28% |
| Philippines | 5% | 11.829 | 14.890 | 13.626 | -8% |
| Egypt | 5% | 24.689 | 19.126 | 12.423 | -35% |
Do you need additional information on dairy Import/Export? Subscribe to the Dairy World Trade area on CLAL.it
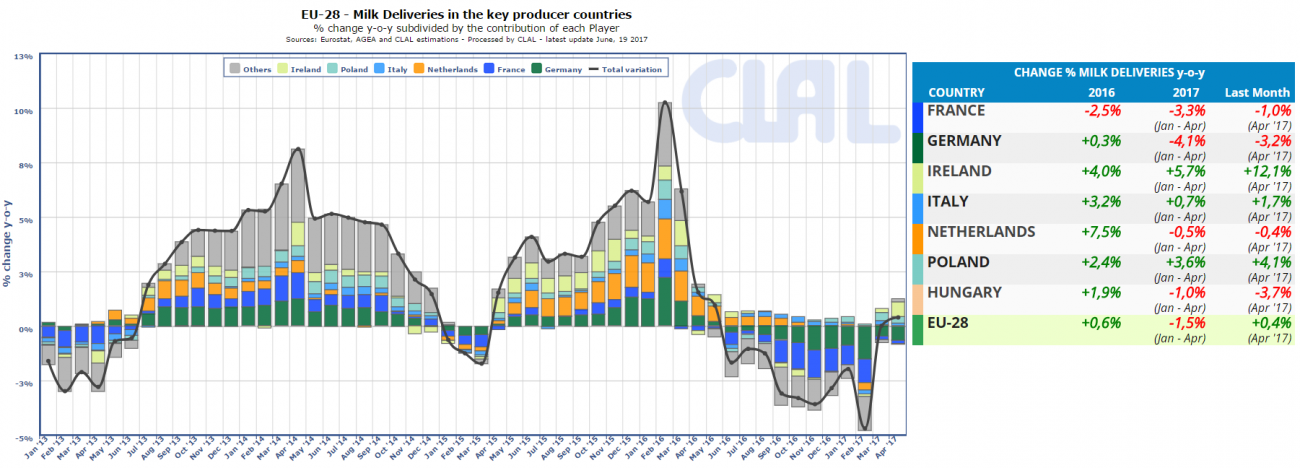
CLAL.it – EU-28: milk deliveries in the key producer countries
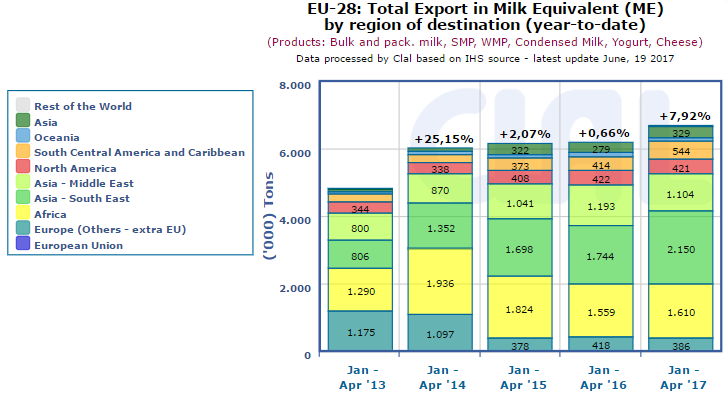
CLAL.it – EU-28: Total Export in Milk Equivalent (ME) by region of destination (year-to-date)
The CLAL.it team is composed of young people who with the help of Computer Science study the dairy market and develop tools to provide the Operators of the dairy sector with a comprehensive real-time view of the national and international market trends.
Leave a Reply
You must be registered and logged in to post a comment.