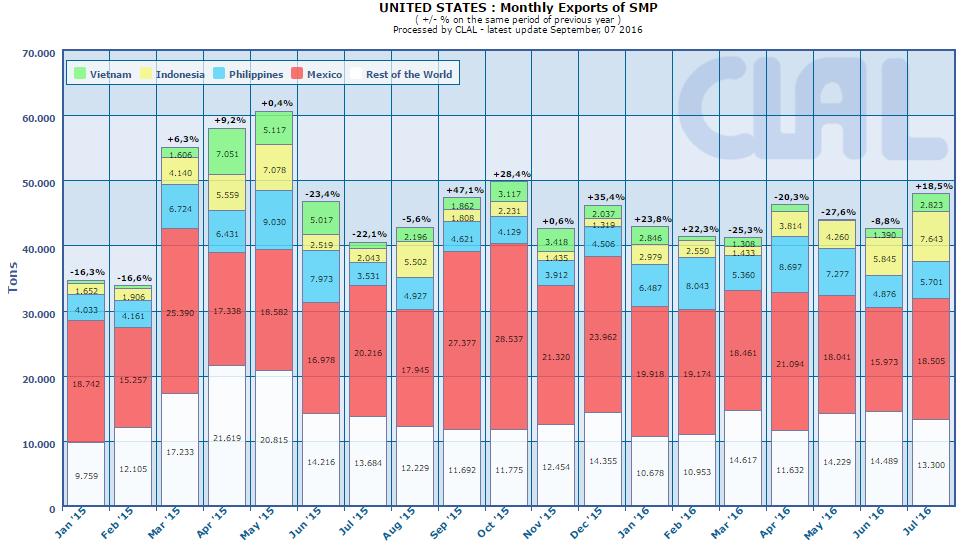
United States dairy exports showed signs of recovery in recent months.
Exports in July 2016 compared to July 2015 increased in volumes for:
- Cream (+854.5%)
- Yogurt and buttermilk (+0.3%)
- SMP (+18.5%)
- WMP (+232.0%)
- Whey Powder (+8.8%)
- Casein (+339.5%)
| UNITED STATES: dairy products Export year-to-date (July) | ||||||
| QUANTITY (Tons) | VALUE (’000 USD) | |||||
| 2015 | 2016 | ± on 2015 | 2015 | 2016 | ± on 2015 | |
| Cheese | 201.552 | 165.198 | -18,0% | 874.077 | 674.258 | -22,9% |
| SMP | 329.371 | 306.105 | -7,1% | 859.907 | 596.062 | -30,7% |
| Whey Powder | 274.287 | 267.232 | -2,6% | 428.767 | 312.800 | -27,0% |
| Infant milk formula | 20.099 | 18.924 | -5,8% | 175.653 | 164.918 | -6,1% |
| Lactose Pharmaceutical | 142.416 | 146.420 | +2,8% | 150.474 | 111.817 | -25,7% |
| WMP | 23.863 | 39.468 | +65,4% | 59.164 | 81.543 | +37,8% |
| Butter | 17.137 | 16.709 | -2,5% | 61.744 | 60.002 | -2,8% |
| Milk and cream | 58.219 | 54.298 | -6,7% | 53.375 | 49.277 | -7,7% |
| of which: | ||||||
| - Milk | 52.667 | 48.813 | -7,3% | 47.672 | 43.509 | -8,7% |
| - Cream | 5.552 | 5.485 | -1,2% | 5.703 | 5.768 | +1,1% |
| Lactose edible | 67.595 | 58.333 | -13,7% | 56.057 | 38.510 | -31,3% |
| Yogurt and buttermilk | 8.606 | 8.627 | +0,2% | 37.598 | 37.825 | +0,6% |
| Condensed Milk | 13.874 | 11.303 | -18,5% | 24.840 | 22.462 | -9,6% |
| Caseinates | 1.753 | 1.307 | -25,4% | 16.775 | 10.715 | -36,1% |
| Casein | 472 | 1.267 | +168,5% | 4.556 | 7.385 | +62,1% |
| TOTAL EXPORT | 1.159.243 | 1.095.192 | -5,5% | 2.802.986 | 2.167.575 | -22,7% |
| Data processed by Clal based on GTIS source. | ||||||
|
United States: CREAM EXPORT Main IMPORTERS of 2016 Period: January-July |
|||||
| Ton | Share 2016 |
2014 | 2015 | 2016 | % on 2015 |
| TOTAL | 5.369 | 5.552 | 5.485 | -1% | |
| Mexico | 47% | 127 | 312 | 2.553 | +717% |
| Canada | 25% | 1.305 | 3.224 | 1.380 | -57% |
| Vietnam | 9% | 231 | 609 | 510 | -16% |
| Bahamas | 5% | 86 | 82 | 266 | +224% |
| Bermuda | 4% | 0 | 60 | 197 | +231% |
|
United States: YOGURT AND BUTTERMILK EXPORT Main IMPORTERS of 2016 Period: January-July |
|||||
| Ton | Share 2016 |
2014 | 2015 | 2016 | % on 2015 |
| TOTAL | 9.153 | 8.606 | 8.627 | +0% | |
| Mexico | 15% | 2.131 | 1.134 | 1.271 | +12% |
| Trinidad & Tobago | 9% | 743 | 841 | 781 | -7% |
| Australia | 7% | 1.017 | 553 | 596 | +8% |
| Dominican Republic | 7% | 605 | 625 | 567 | -9% |
| Costa Rica | 6% | 116 | 256 | 522 | +104% |
|
United States: SMP EXPORT Main IMPORTERS of 2016 Period: January-July |
|||||
| Ton | Share 2016 |
2014 | 2015 | 2016 | % on 2015 |
| TOTAL | 360.136 | 329.371 | 306.105 | -7% | |
| Mexico | 43% | 122.210 | 132.504 | 131.167 | -1% |
| Philippines | 15% | 45.914 | 41.883 | 46.441 | +11% |
| Indonesia | 9% | 28.737 | 24.897 | 28.525 | +15% |
| Pakistan | 5% | 2.762 | 16.946 | 15.012 | -11% |
| Malaysia | 4% | 19.596 | 16.331 | 13.470 | -18% |
|
United States: WMP EXPORT Main IMPORTERS of 2016 Period: January-July |
|||||
| Ton | Share 2016 |
2014 | 2015 | 2016 | % on 2015 |
| TOTAL | 36.049 | 23.863 | 39.468 | +65% | |
| Mexico | 66% | 3.368 | 3.180 | 26.205 | +724% |
| Colombia | 21% | 1.432 | 1.301 | 8.092 | +522% |
| Canada | 4% | 837 | 1.059 | 1.688 | +59% |
| Vietnam | 1% | 11.101 | 10.032 | 480 | -95% |
| El Salvador | 1% | 157 | 290 | 402 | +39% |
Do you need additional information on dairy Import/Export? Subscribe to the Dairy World Trade area on CLAL.it


Leave a Reply
You must be registered and logged in to post a comment.